
BizTalk360 is designed exclusively for managing and monitoring complex BizTalk Server environments, offering over 100 features to streamline day-to-day operations. A perfect To-Do List is essential to help users maximize the benefits of BizTalk360.
Once BizTalk360 is installed, administrators can set it up using the comprehensive to-do list. You can find this feature by navigating to the following category:
Home -> Manage environment (Production or any environment) -> Environment settings -> General -> To Do List.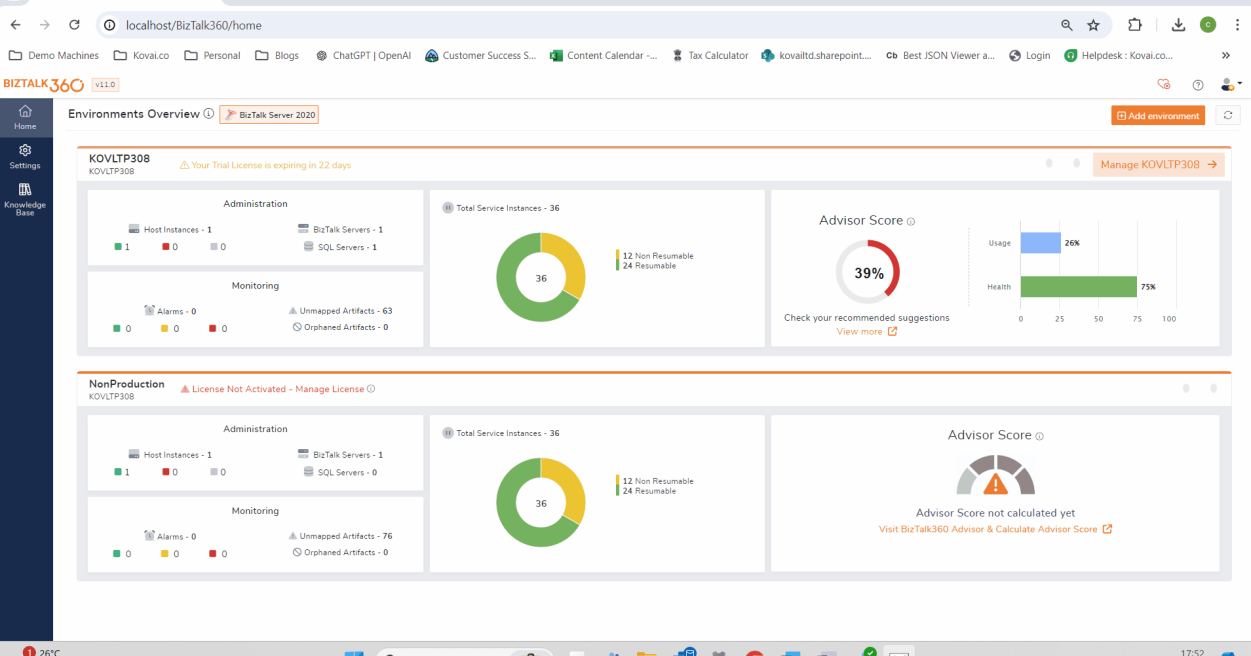
Usually, the product works independently, but a few sections require manual configurations to use the product more efficiently. Simply clicking the Configure button next to each option will take users to the respective page to perform the configuration.
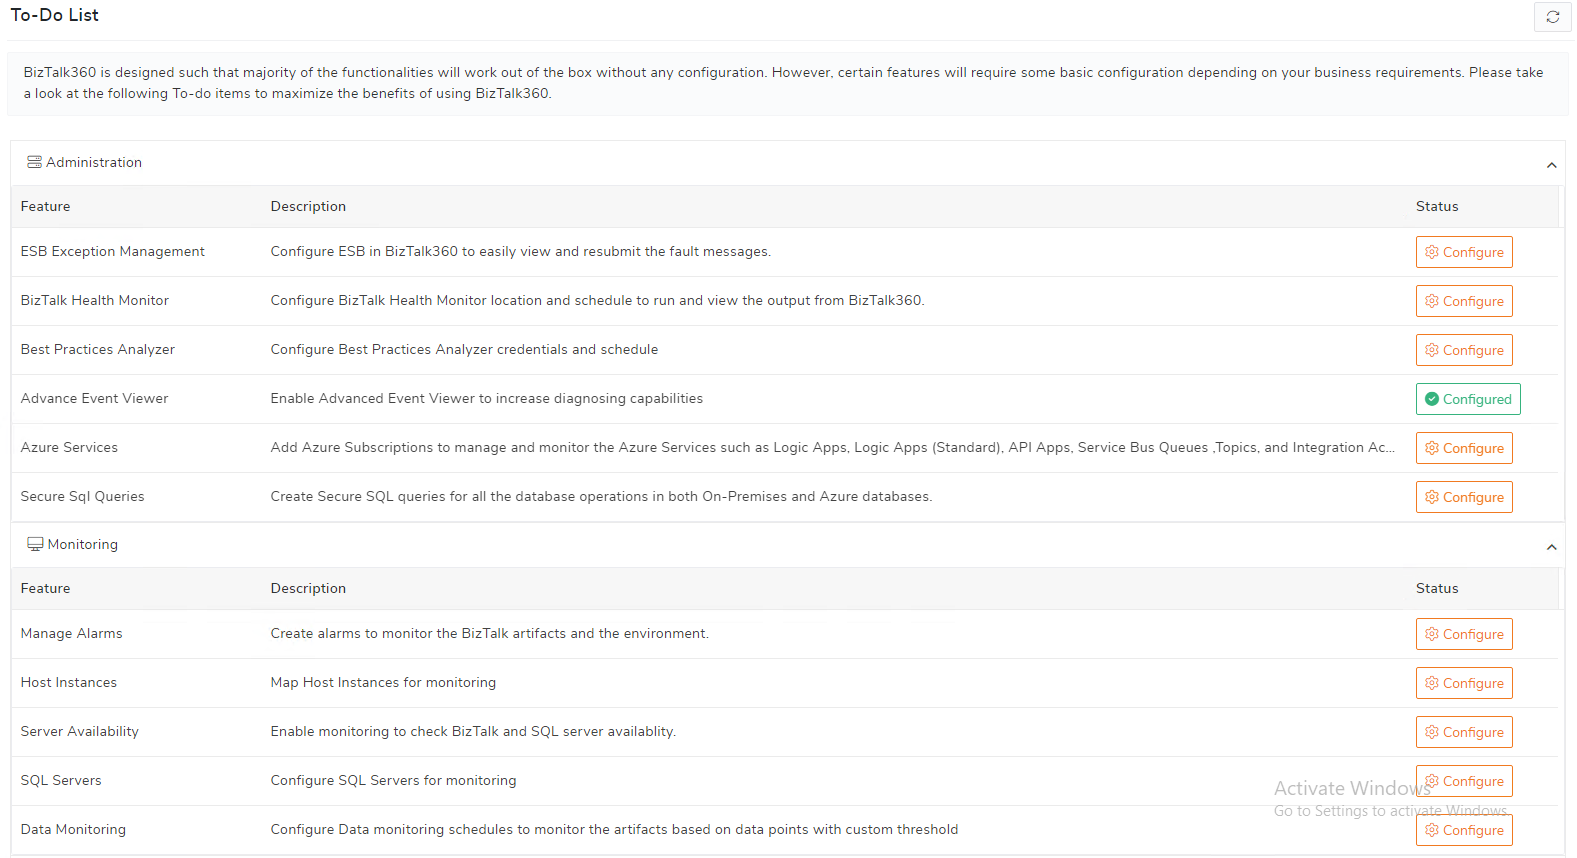
The following table provides insights into available features and their corresponding licensing tiers. If your licensing tier is not appropriate, you will not have access to the functionality.
| Features available | Licensing tier |
| ESB Exception Management | Gold |
| BizTalk Health Monitor | Gold |
| Best Practice Analyser | Gold |
| Advanced Event Viewer | Gold |
| Azure Services | Platinum |
| Secure SQL Queries | Gold |
| Manage Alarms | Silver |
| Host Instances | Gold |
| Server Availability | Gold |
| SQL Servers | Gold |
| Data monitoring | Platinum |
| Performance Data Collection | Platinum |
| Automated Tasks | Platinum |
| Knowledge Base | Silver |
| Reports | Based on the feature you map; you can collect respective reports. |
| SMTP | Silver |
| System Notification | Silver |
Using the Administration module, users can manage the BizTalk Server environment. It offers exceptional features that provide a perfect starting point for users in the To-Do list.
Errors and exceptions can occur in a range of contexts and during different processing stages in an ESB. Users can now efficiently handle exceptions and perform various operations like receive ESB exceptions, view message information and properties, edit t the message, bulk submit the messages, and resubmit messages to HTTP WCF OnRamp in BizTalk360.
Users can select the Configure button and provide the following details:
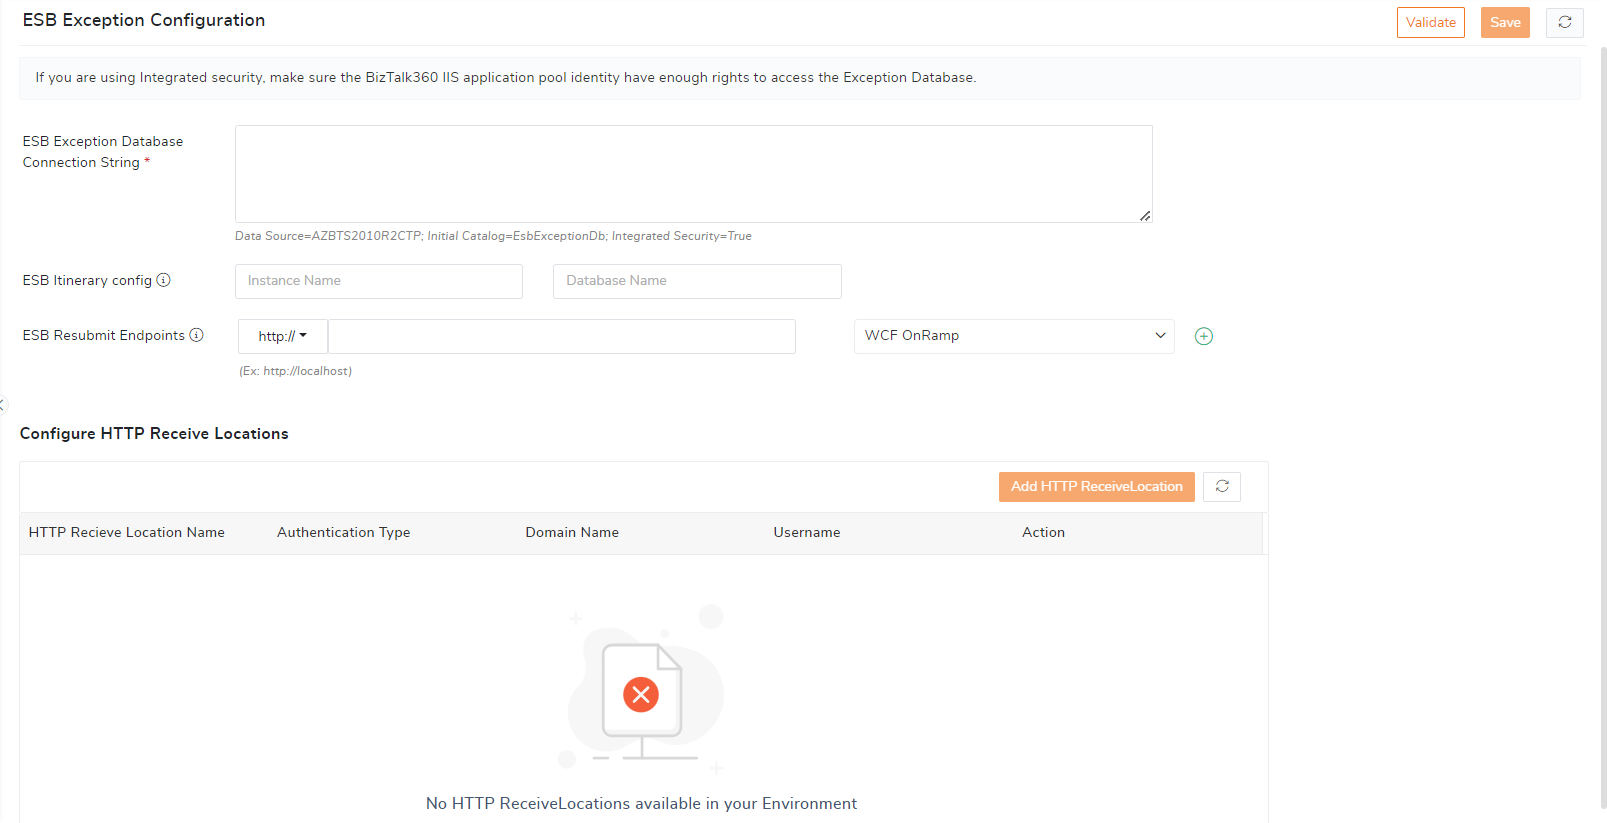
Once you have provided the details BizTalk360will fetch information from the database. Follow the link to learn more about managing and monitoring ESB.
This tool can be used to analyze and fix issues in the BizTalk Server environment. BizTalk360 is a one-stop portal that incorporates multiple portals to reduce the context switching between multiple portals.
To configure BHM in BizTalk360 make sure that BHM is installed in the server where BizTalk360 is running. Select Configure -> Configure path -> System settings -> BizTalk Health Monitor -> Provide details of installation path.

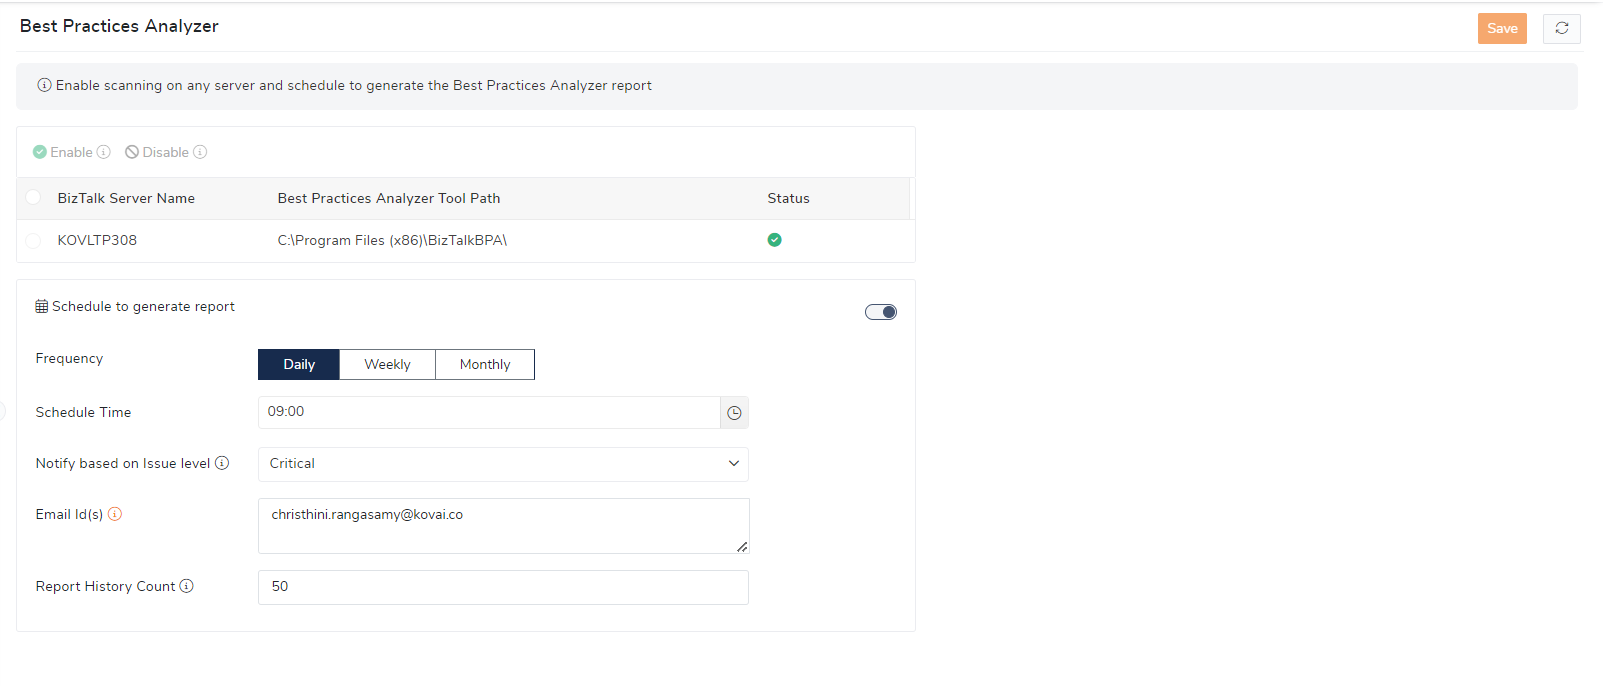
This tool is provided by Microsoft to help administrators and developers ensure that the BizTalk Server environment adheres to recommended best practices. To generate a BPA report from BizTalk360, you need to configure it at the environment level.
Select Configure-> System settings-> Global configuration-> Best Practice Analyzer -> provide credentials.
You will be able to see the issues that your BizTalk Server environment holds, additionally, you can even automate the scanning by configuring the schedule. If you want to get a health report of your environment weekly, then you can configure a weekly schedule.
When troubleshooting operational problems in the BizTalk Server, your first point of reference should be the the BizTalk Admin Console. If you don’t find anything obvious, your next point of reference should be the Event Viewer. However, this can be time-consuming as it requires configuring and searching through multiple RDP connections.
Using BizTalk360’s advanced event viewer capabilities, users can query for both BizTalk/SQL logs from a single interface, obtaining results in seconds. To configure this in BizTalk360, follow these steps:
Select Configure -> Enable Advanced event viewer for data collection -> Enable the BizTalk/ SQL Servers.

Users can add Azure subscriptions to manage and monitor Logic Apps, Logic Apps (Standard), API Apps, Service Bus Queues, Topics, and Integration Accounts directly by adding Subscription details in BizTalk360.
Select Configure -> Add Subscription -> Provide credentials
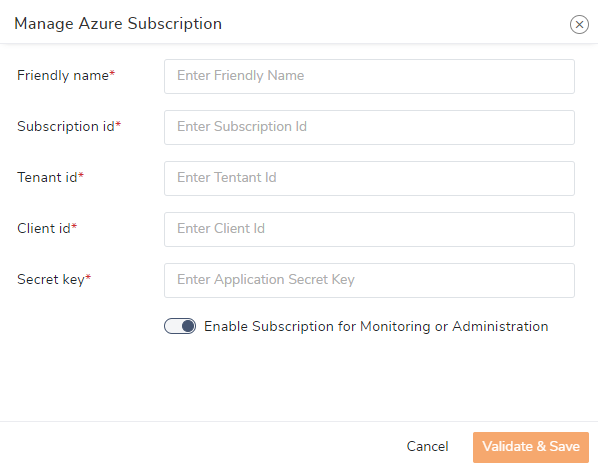
Users can create Secure SQL Queries for all the database operations in both On-Premises and Azure databases.
Select Configure -> Write a query -> Run query
Under Monitoring, the following features need to be configured for successful usage of monitoring in BizTalk360.
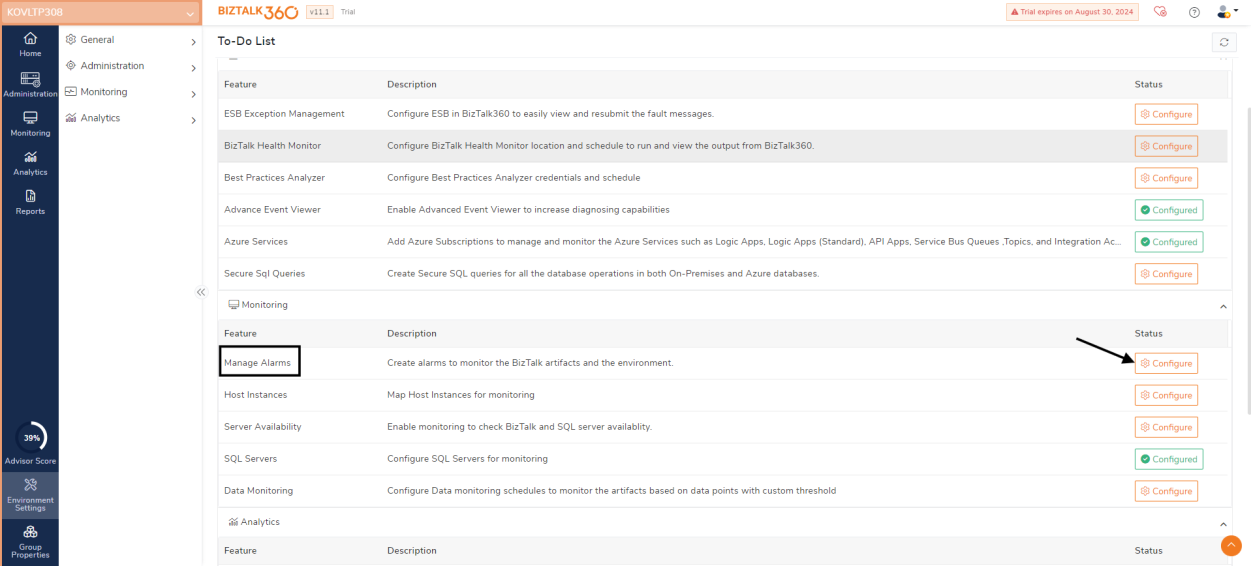
Users can create alarms, choose their preferred communication channels, map the alarm to an application, and receive notification of any violations. Select Configure -> New Alarm
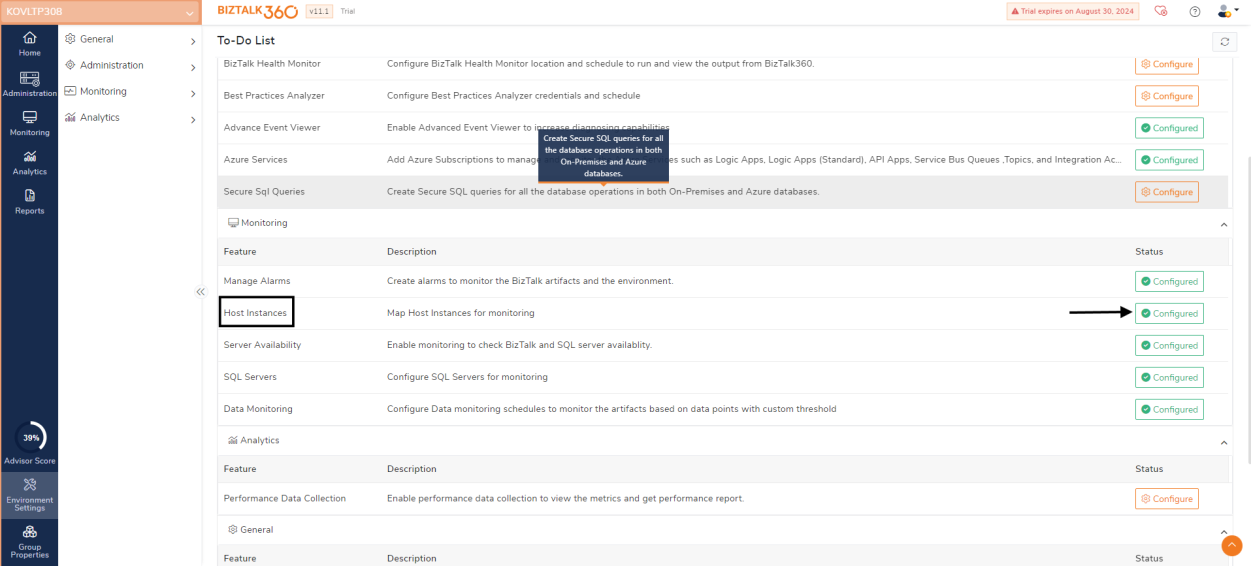
To effectively monitor host instances, it’s crucial to map them accurately. This involves identifying all active host instances and ensuring they are correctly configured for monitoring. By doing so, administrators can track the performance and health of these instances, promptly identifying and addressing any issues that arise. Properly mapped host instances enable a more streamlined and efficient monitoring process, contributing to the overall stability and reliability of the overall system.
Select Configure -> set “expected state”
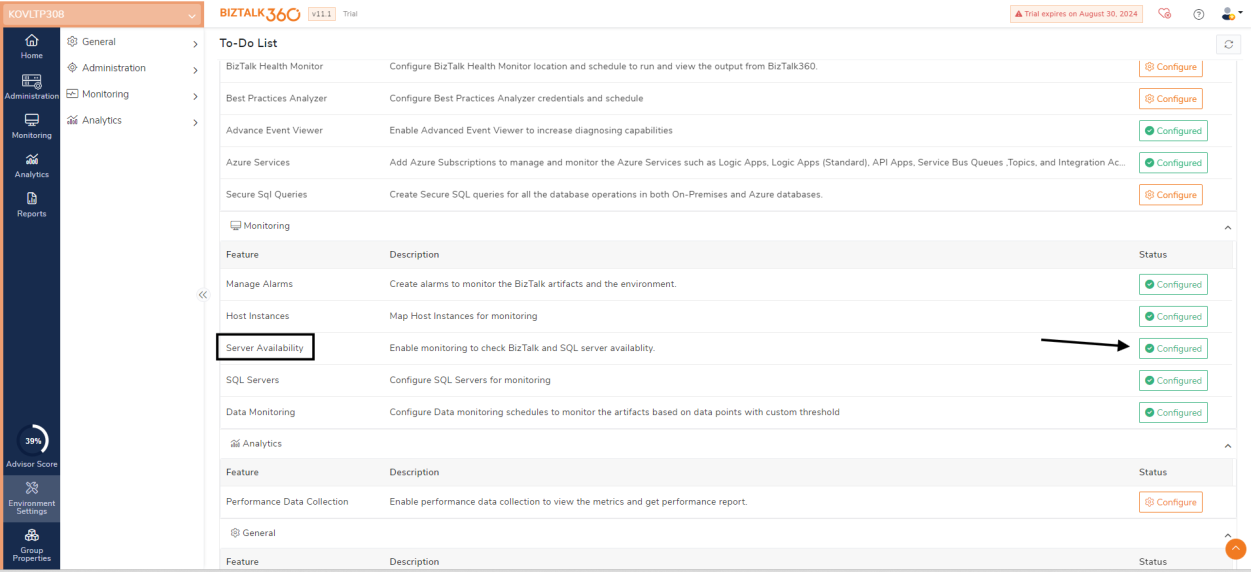
Enable monitoring to check the availability of both BizTalk and SQL servers. This allows administrators to promptly detect any downtime or performance issues, ensuring smooth and efficient server operation. Effective monitoring helps maintain system stability and reliability, allowing for quick responses to potential problems.
Select Configure -> set up monitoring configuration rules -> enable for monitoring
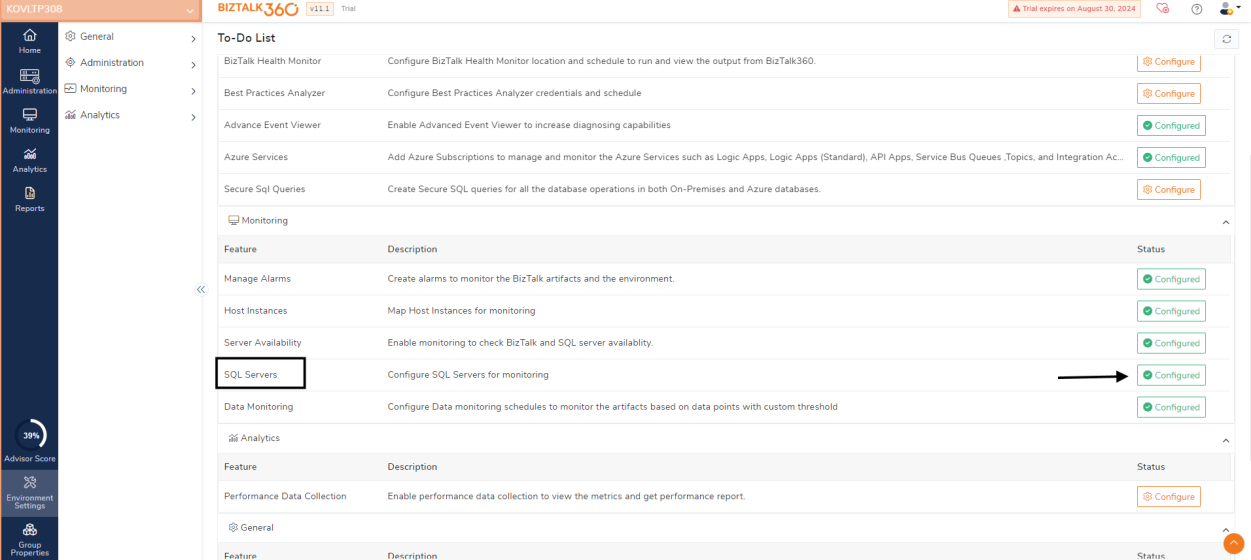
To ensure optimal performance and reliability, it’s essential to configure SQL Servers for monitoring. Continuous monitoring of these metrics allows administrators to quickly identify and address issues, prevent potential downtime, and maintain the overall health of the SQL Servers. Proper configuration of monitoring tools is crucial for managing and optimizing SQL Server performance. Select Configure -> Add SQL Server -> Non clustered / Clustered SQL Server
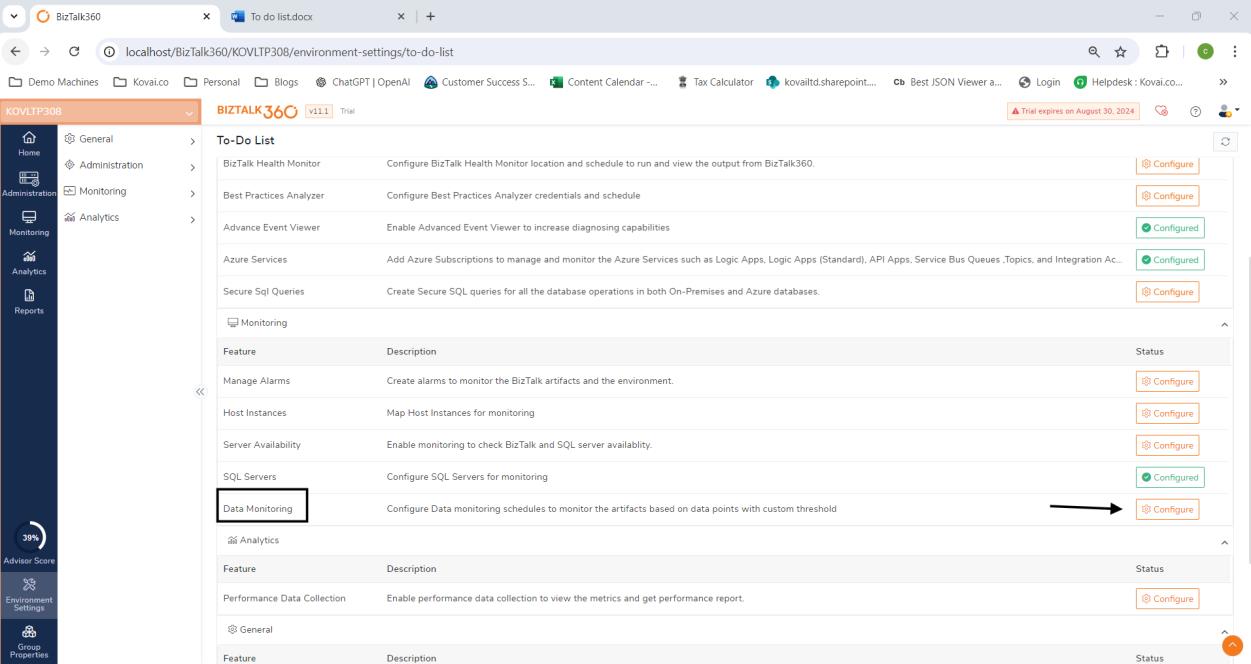
Configuring data monitoring schedules involves setting up a system to monitor artifacts based on specific data points and custom thresholds. This process includes determining the key data points that need to be tracked and establishing custom thresholds that when exceeded, trigger alerts or actions. By doing so, administrators can ensure that the system’s performance and integrity are continuously monitored, allowing for the early detection of potential issues and the timely implementation of corrective measures. Effective scheduling and monitoring contribute to maintaining the overall health and efficiency of the system. Select Configure -> Add schedule
BizTalk360 aims to provide an out-of-the-box tool with capabilities like the Performance Monitor tool in Windows servers, featuring a performance analyzer dashboard that includes reporting, messaging patterns, and a throttling analyzer. The analytics module offers a visual display of the most critical performance counters, consolidated and arranged on a single screen for easy, at-a-glance monitoring.
Select Configure -> select enable performance data collection for “server”

Automated Tasks Users can create tasks to automate the process for artifacts like Applications, Host Instances, Receive Locations, Send Ports, Logic Apps, IIS Servers, and NT Services.
To automate this process, you can navigate as follows:
Select Configure -> New task configuration -> Choose according to your requirements
Creating and linking articles for errors is essential for quick reference and issue resolution in the future. By documenting common errors and their solutions, and linking these articles within BizTalk360, administrators can streamline the troubleshooting process. This proactive approach ensures that team members have immediate access to relevant information, reducing downtime and improving efficiency when addressing recurring issues.
Select Configure -> New article -> Article title -> Error code -> Provide content and credentials
Configuring reporting schedules to receive dashboards and SQL query results as reports is crucial for maintaining efficient monitoring in BizTalk360. By setting up regular intervals for these reports, administrators can ensure they have timely access to critical data and performance metrics.
Select Configure -> new report -> create schedule
For a healthy BizTalk environment, users must be aware and be notified in any type of notification channel. Once you configure SMTP, users can be able to receive notifications via mail.
Select Configure -> admin mail -> SMTP Server
Enable system notifications to receive alerts for critical application events or activities. This ensures administrators are promptly informed of significant issues, allowing for swift action to minimize downtime and prevent minor problems from escalating. Effective notifications are essential for robust system management and reliability.
Select Configure -> admin mail -> Schedule configuration
BizTalk360’s comprehensive to-do list covers essential tasks for effective system monitoring and management, crucial for optimizing performance, resolving issues promptly, and ensuring system reliability in BizTalk environments. If you are new to BizTalk360 and would like to have a demo with the team to get a better understanding of the product, then you can reach out to our team for further assistance.