
We hope that all are super excited to know about what’s going to be new in the BizTalk360 V10 version. Yes, in this blog I will give you a piece of cake from V10, on instrumenting your Azure Entities and Manage/Monitor it from BizTalk360 (v10)
Azure gives an expanding array of products and services designed to meet all your needs through a convenient, easy-to-manage platform. Microsoft maintains a growing directory of Azure services, with more being added all the time. All the elements were necessary to build a virtual network and deliver services or applications to a global audience. Since it is so important to keep up the business, we need to ensure that these entities are up and healthy.
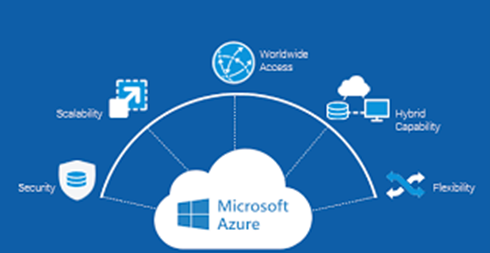
In the earlier versions, the publish setting file of the azure subscription was required, to get Azure integrated with BizTalk360. In addition, the user needs to run the permission script, once done you will successfully get connected. To ease you more, in this upcoming V10 by providing just the Subscription ID, Tenant ID, Client ID, and Secret Key in BizTalk360, we will get you connected to Azure.
Once after connecting to Azure you can use the Team management to limit\control the user’s access over the Azure entities.
Understanding the business impact in Microsoft Azure, BizTalk360 facilitates the users by providing the below Azure features. For other users, other than the Azure owner to access the below Azure entities in BizTalk360, we need to create the BizTalk360 user and provide them with the required access permission (using Team Management).
Logic Apps have a large collection of connectors to Azure Services, SaaS applications (FTP and Enterprise Integration Pack for B2B scenarios; along with the ability to build custom connectors if one isn’t available. Each pre-existing connector has a range of ready-made actions that can be used and configured via the visual designer or in code.
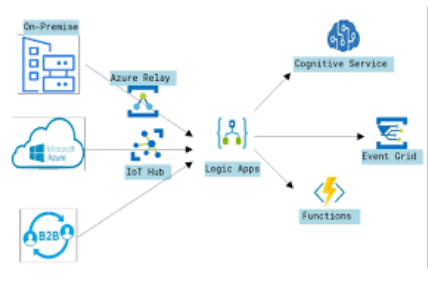
In the Operation –> Azure Service –> Logic Apps users can view the available Logic apps under the selected Azure subscription the below actions can be performed along with bulk actions as well.
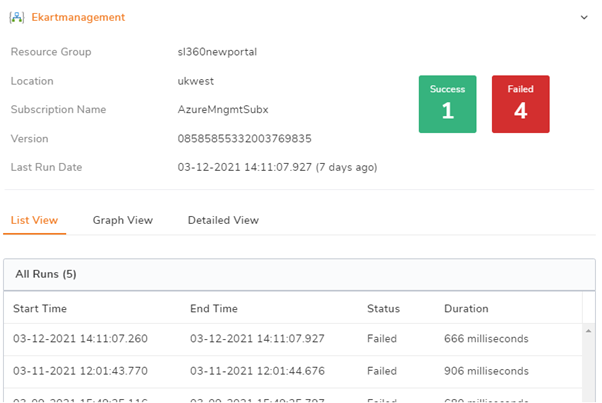
The trigger details can be viewed by clicking on the eye icon of the respective logic app. To provide a detailed view of the logic apps details, the following views are available, List, Graph, and Detailed view. You can also download the graph view, which will be easy to share the details of the Logic apps with anyone.
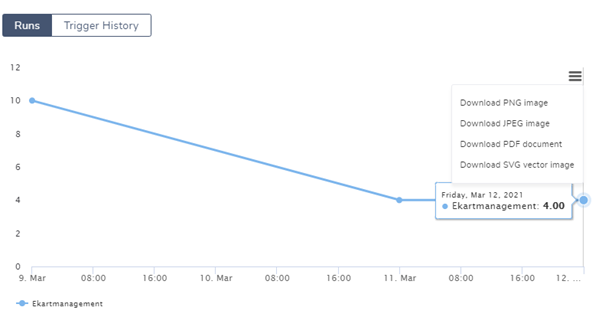
The monitoring feature in the BizTalk360 automates to manage the Azure Logic Apps, Services Bus Queue, API End points. As per the user’s need, you can set the expected state for the entities. When the azure entities are not meeting the expected state, the violation occurs which will tend to send the alert to the configured mail id. So, the user can know if any entity goes down. By enabling the Autocorrect function in the logic app and API apps monitoring, BizTalk360 will check for the Logic Apps expected state and if the expected state is not met, it will move to the expected state. In case of any failure in autocorrect after the configured number of attempts, the down alert will be triggered.
Service Bus is to decouple applications and services. As we need to decouple applications and services, the data can be transferred between different applications and services using messages. The messages can be sent to the queue in the service bus.
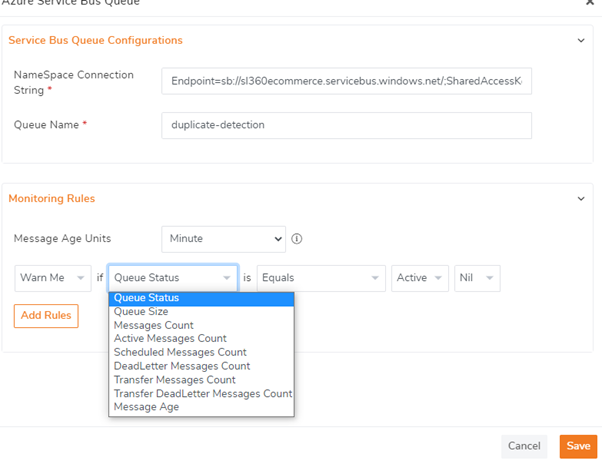
As per the business need you can configure the Service Bus Queue monitoring by setting the Monitoring Rules with the expected state or value for the preferable Message Age Units(Secons\Minutes\Hour\Days) or based on the message count.
Azure API Apps are structured for software developers and vendors/publishers to provide them with means to create, deliver, use and manage Web API’s for their software/apps. Azure API Apps can be used to provide SaaS connectivity, Integration with other Azure App services such as Azure Logic Apps, Web Apps… API apps in the configured Azure subscription will get listed in the Monitoring-> Manage Mapping -> Azure Services -> API.
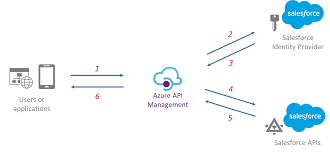
To monitor the API Apps, we need to configure the API to an alarm by setting the expected state. After mapping to the alarm, the API App endpoint under the corresponding API App can be configured for monitoring by clicking on the Configure API App Endpoints button, pointing to the endpoints – say, /api/Dev., This will open the configuration blade where the user-friendly name and the endpoint URL fields will get auto-populated. The other monitoring configuration details which are optional like the payload, header, and response time can be configured. In case if the proxy is used, the details can be set in the proxy details section.
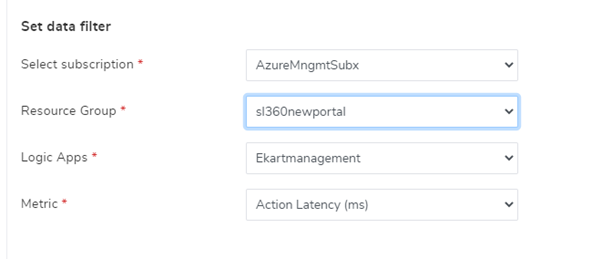
The logic app monitoring support is extended to the data monitoring section as well, in which a schedule can be created to monitor the logic apps. Users shall keep track of the logic apps available under different subscription and resource groups. The logic apps will get listed based on the resource group selected. As per the monitoring frequency set, the success or failure alert is triggered based on the conditions set. The advantage of having a data monitoring option for the Logic apps is that there are more filter options available to easily monitor the Logic apps like the total successful runs, action latency, billable trigger executions, and much more. This will help the users to check for the logic app executions and take necessary actions.
BizTalk360 with its extended support in the Azure entities keeps you well alarmed with its state, with no manual interaction on Azure. If want to explore the above, why not give BizTalk360 a try! It takes about 10 minutes to install over your BizTalk environments and you can witness and check the security and productivity of your own BizTalk Environments. Get started with the free 30 days trial.