As you know BizTalk360 keeps up its standard by introducing new features or by improving existing features, that ease the user experience to the next level in every single release. We are delighted to inform you that the next version of BizTalk360 V9.1 will be released for production use within a couple of days!
BizTalk360 is already capable of monitoring clustered BizTalk and SQL Server resources such as Disks, System Resources, Event Logs, and NT Services. In the case of the failover scenario, the BizTalk360 monitoring service will automatically take the active server for monitoring.
From this version on, the user can monitor clustered NT Services by setting up the expected state of the clustered service as ‘At least One Active’.
Consider a scenario where you have a clustered BizTalk environment, in which your Enterprise Single sign-on service is configured as Generic Type, i.e the SSO service is clustered, and you want to ensure that the SSO service should up and running in at least one of the clustered nodes. This can be easily achieved through BizTalk360 NT service monitoring.
With this feature, you can monitor the state of your NT services in your BizTalk or SQL servers by configuring the Expected state as Started or Stopped. The clustered NT service can be monitored by configuring the expected state as “Atleast One Active”. The BizTalk360 monitoring service will ensure that the configured service is always up and running in any of the respective clustered nodes. An alert will get triggered to the configured email-Id when the service goes down in all the nodes.
NOTE: For better understanding, the clustered nodes are grouped with similar colour code.
The user can also set up AutoCorrect for this. In this case, when the SSO service goes down in both the clustered nodes, then the BizTalk360 monitoring service will automatically try to start the service in any of the nodes. With this, you can ensure that there is no downtime in the service.
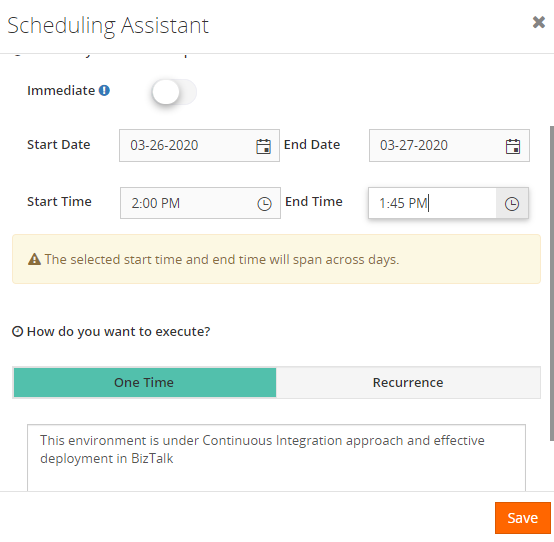
The latest version of BizTalk360 will hold the enriched form of Stop alerts for maintenance, which is renamed as “Scheduled Maintenance”. Schedules can be configured to stop monitoring immediately or at a later point in time, based on your maintenance plan.
You can set up the maintenance immediately from the current time by enabling the ‘Immediate’ option and providing the maintenance End Date and Time in the schedule configuration.
Configure the schedule with Start and End Date/Time to stop monitoring during the future maintenance period. A future maintenance schedule can be configured for both once or recurrence execution.

The user can now also edit the schedule and manually stop the maintenance in between, i.e. before the maintenance period gets over. So, it is not required to wait until the end of the configured maintenance cycle.
Schedule actions such as create, delete, modify, stop maintenance are audited for further reference.
Monitoring Status Enabled/Disabled is introduced in Web Endpoint monitoring. This enables the user to define when BizTalk360 should start/stop monitoring the configured Web Endpoint.
For instance, you may configure multiple Web Endpoints, but you temporarily don’t want to monitor all the endpoints. In this case, you can set the monitor status as Disabled for those endpoints.
BizTalk360 will start to monitor the configured Web Endpoints only if the status is set as Enabled.
Users can now easily copy all the artifacts mapped for monitoring and the data monitoring configurations from one alarm to another. With the Clone alarm feature, users can copy both the alarm configurations and all the artifacts mapping configurations.
With this enhancement, the user can monitor the oldest message in an MSMQ queue by using the threshold parameter ‘Message Age’. This threshold parameter is added to monitor and alert the oldest message in MSMQ, based on the configured message age units’ Days/hours/minutes.
All the artifacts that have been configured for monitoring under a particular alarm are listed in the Manage Mapping section in Monitoring Dashboard.
The user can define for which error type(s) notifications should be sent through SMTP notification channels, i.e. only in case of Error & Warning or Error/Warning/Healthy state of the artifacts.
The created Data Monitoring schedule can be edited and renamed at a later point in time. Also, users are restricted to create a duplicate schedule for the same alarm under the same monitor type.
Widget to show the SQL server performance (CPU & Memory Usage) is added in the Analytics dashboard.
In the Reporting section, the Secure SQL Query widget can be edited and re-associated to any configured Secure SQL Query.
In earlier versions, the Advanced Event Viewer feature collected all the Event log entries for the configured Event Logs and Event Log Sources, but irrespective of error levels. From this version on, to avoid data growth, the user can (de)select the error levels (Information, Warning, Error, etc ) which should be collected. This way, BizTalk360 will start collecting event logs based on the selected error levels.
EDI AS2/MDN message content can be viewed as an encoded and wired format.
We are proud to share that BizTalk360 is now compatible with BizTalk Server 2020!
Under BizTalk Group properties, users can view newly added properties in BizTalk Server 2020.
The recurrence schedule configured in BizTalk Server 2020 receive locations can now be viewed in BizTalk360.
Considering the feedback from our customers, BizTalk360 will continue to provide more useful features. Why not give BizTalk360 a try! It takes only 10 minutes to install on your BizTalk environments and you can witness and check the security and productivity of your own BizTalk Environments.