
We’re excited to introduce BizTalk360 version 11.3. This release brings advanced automated tasks with pre-defined templates, enhanced monitoring, and improved monitoring service performance.
Active MQ Monitoring – Monitoring the Active MQ queues helps to address the issue instantly.
Automated Task predefined templates – Predefined templates for the Custom workflow offer a quick start with ready to use settings and structures for common use cases like Artifact Shut down for Maintenance, Resume Artifacts After Maintenance.
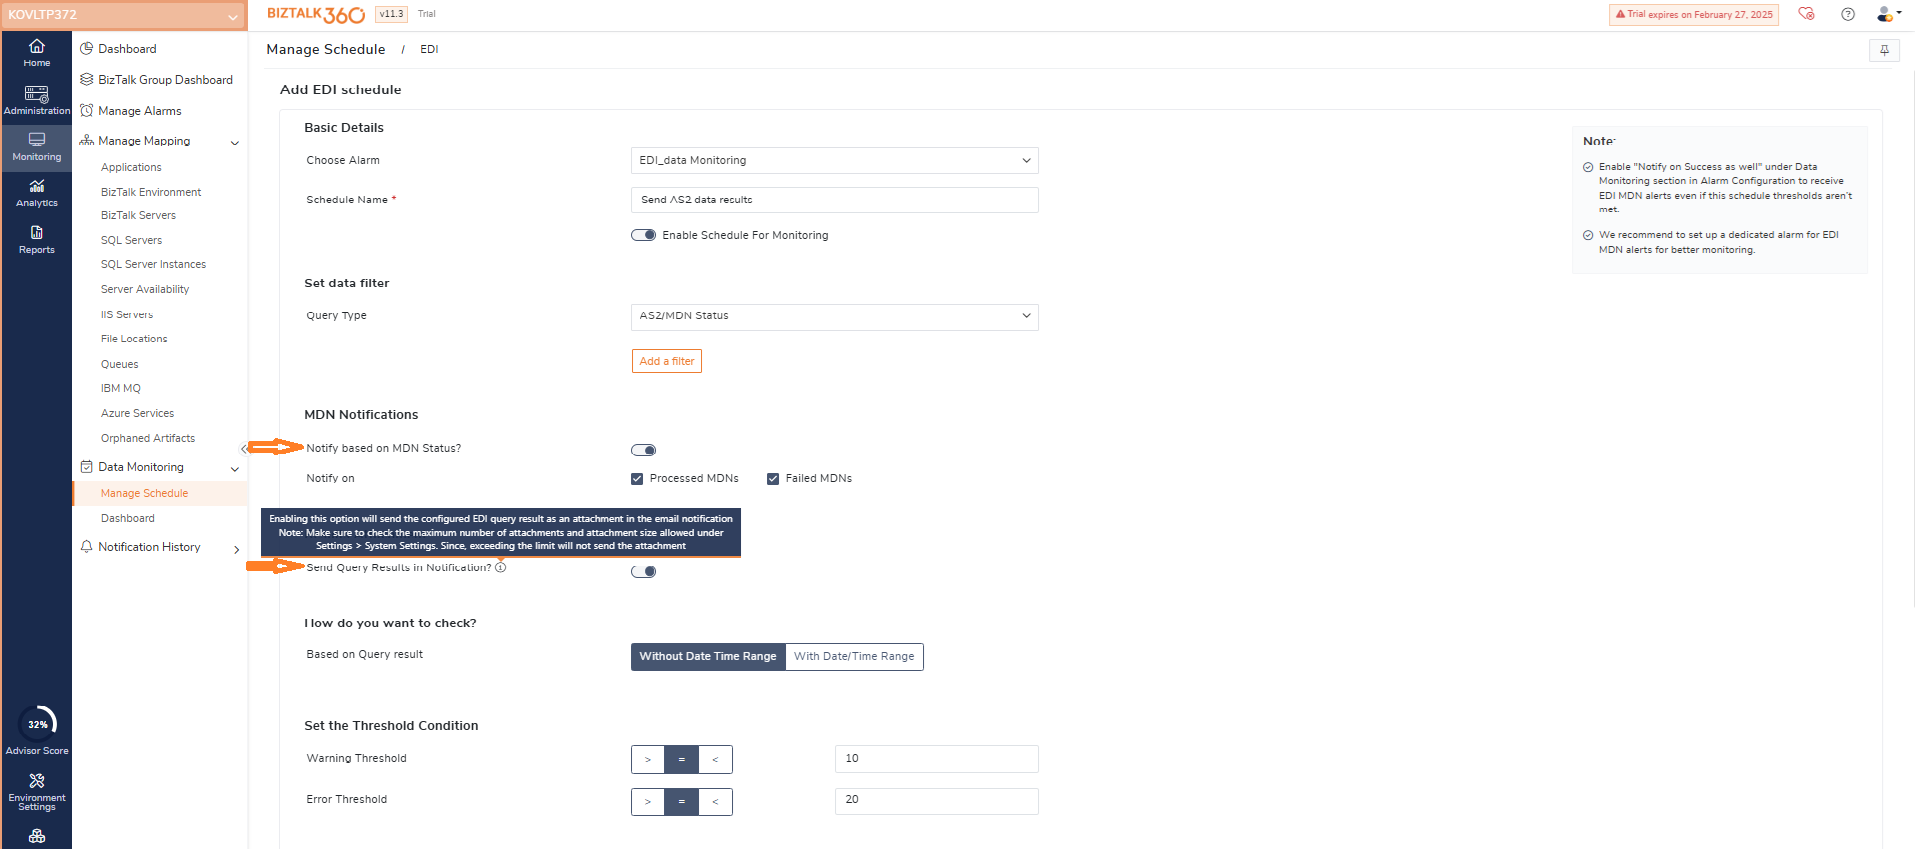
EDI Improvements – Query results can be sent as alert attachments. Customizable AS2/MDN notifications for processed or failed MDNs.
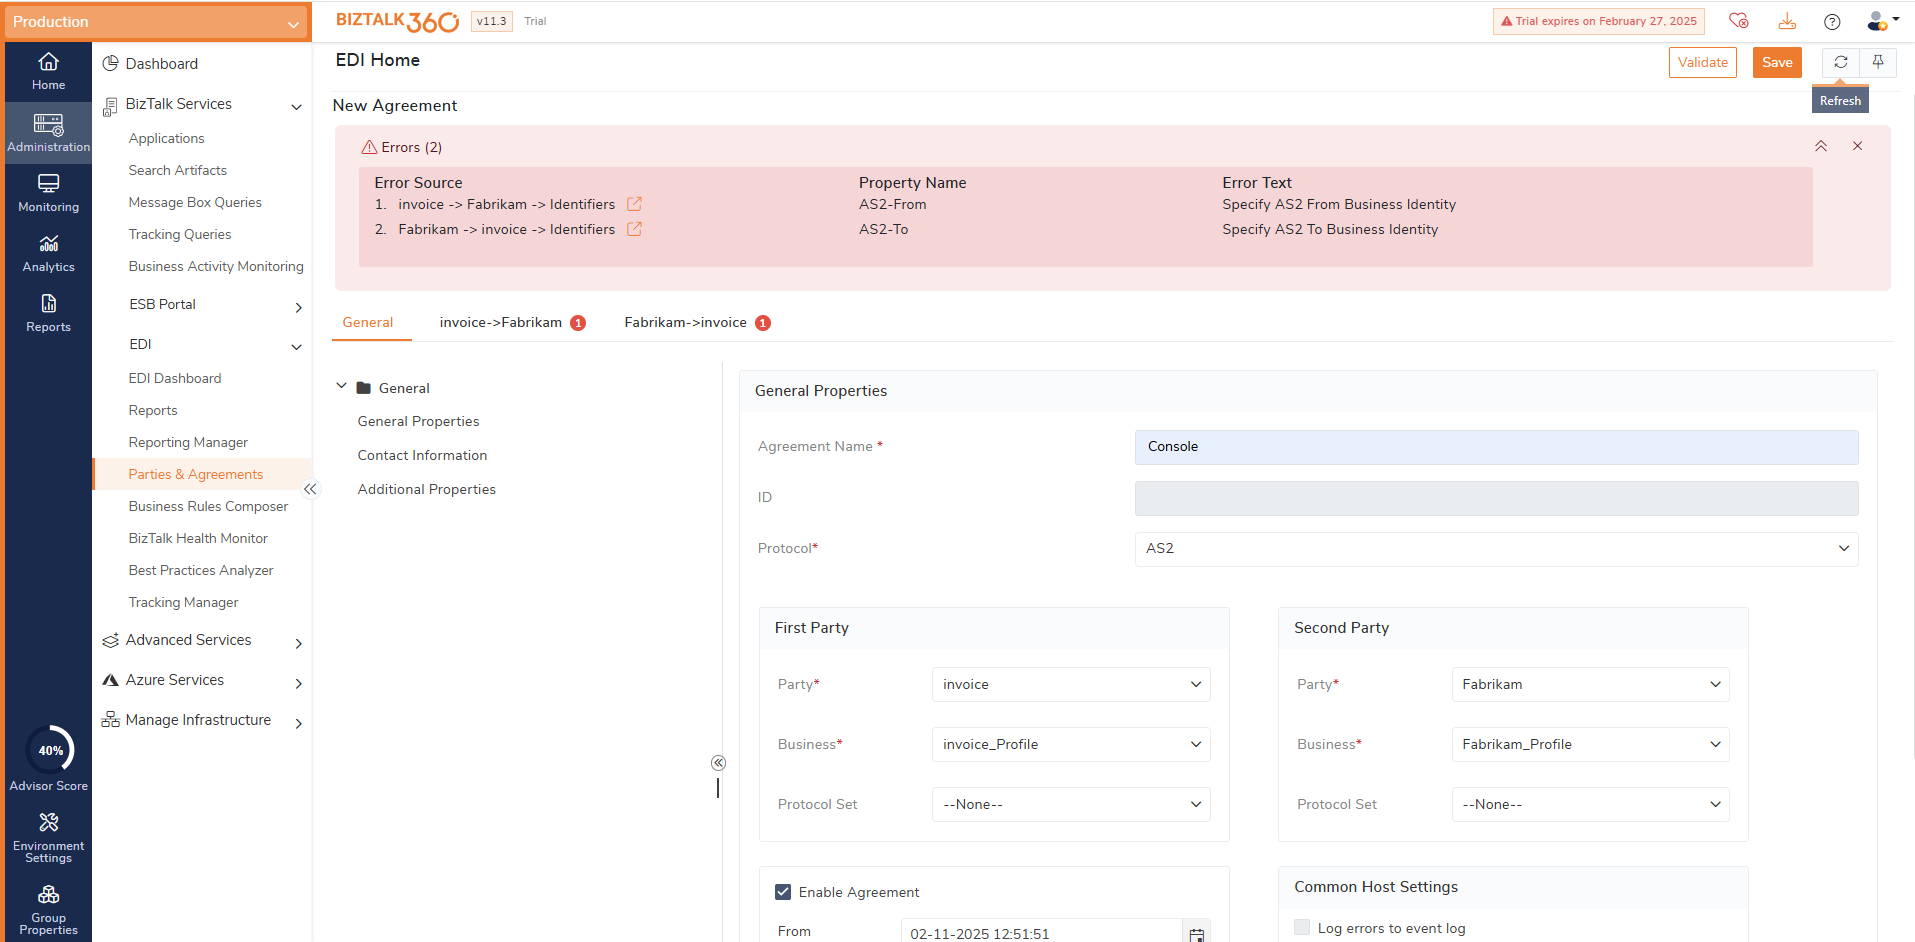
EDI Administration – Improved the EDI parties & Agreements creation with more user friendly.
Monitoring Improvements – Enhanced the monitoring with always on SQL server groups, IBM MQ client connection, process monitoring and EDI data monitoring.
Reporting Improvements – Customizable email template and multiple SQL query selecting.
ActiveMQ is a powerful messaging system with several benefits as it ensures message delivery, ordering, and persistence while supporting transactional messaging, high-performance data streaming, asynchronous communication, cross-language compatibility, and reliable system integration.
ActiveMQ queue monitoring is crucial for real-time issue resolution. You can track the various metrics in the ActiveMQ queue
In BizTalk360, alerts are triggered instantly when queue status violations or metric mismatches occur.
It’s simple just provide the host, port, and authentication details. Once connected, all available queues will be listed. You can then set the expected state or configure threshold rules for metrics like message size, enqueued messages, expired messages, and the number of consumers and producers.
Consider a scenario of monitoring the size of message. You can set the rule to send warning alert,
BizTalk360 monitoring service will trigger a warning alert if the above conditions are not satisfied so that you can take the necessary actions.
We have introduced couple of predefined templates that you can use to setup a custom workflow task in few clicks.
1.Shutdown Artifacts for Maintenance –
This template streamlines BizTalk maintenance by stopping artifacts and host instances, disabling tracking, alarms, and event log collection, and backing up essential databases. It’s perfect for deployments, patch updates, and system maintenance.
2.Start Artifacts After Maintenance
Once after the maintenance, you can start all BizTalk artifacts and host instances, and re-enable tracking, alarms, and event log collection using this template.
3.Restart Artifacts to Handle Unprocessed Files
Use this template to automatically restart BizTalk artifacts, like receive locations and send ports, if files remain in directories for too long. This helps prevent stuck files and ensures continuous processing.
4.Free Up Disk & Database Space
This template creates a custom workflow to clear outdated tracking data, reduce spool sizes, and free up disk space to optimize system performance.
5.Reverse Workflow Actions
This task is ideal for performing the reverse of previously executed actions, turning off what was turned on, and vice versa.
AS2/MDN Transactions monitoring
Consider a Retail company, exchanges critical purchase orders, invoices, and shipping notices with its suppliers via EDI AS2. These transactions must be securely transmitted, acknowledged, and monitored to ensure compliance, order fulfilment, and business continuity.
Monitoring the AS2\MDN transactions helps to Tracks AS2 transactions and MDN acknowledgments to detect failures or delays instantly.
Query results will be attached in alerts for all EDI query types. Additionally, for AS2/MDN queries, you can customize notifications to be triggered specifically for processed or failed MDNs, allowing you to take necessary actions promptly.
Creation of EDI parties and agreements is improved with more user-friendly experience by displaying field validation errors along with their resolutions. This eliminates the need to search through lengthy forms or navigate different sections to identify and resolve issues. Also enabled direct creation of EDI Parties & Profiles from the Tree View itself.
Client Channel Definition File –
BizTalk360 enables you to monitor IBM MQ queues, channels, and listeners by configuring the queue manager.
In IBM MQ, a client connection allows applications on different machines to access queue managers on remote systems without requiring a full MQ installation on the client machine.
To meet customer requirements, incorporated client connections into its configuration process, bridging the gap in queue manager setup.
IBM MQ channel monitoring –
We have addressed the customer suggestion to show the state as “Started” when the channel is Running or Inactive.
Queue type indication –
A queue manger can have many types of queues (Local or Remote), and we indicate type of queues to avoid multiple switching between multiple applications.
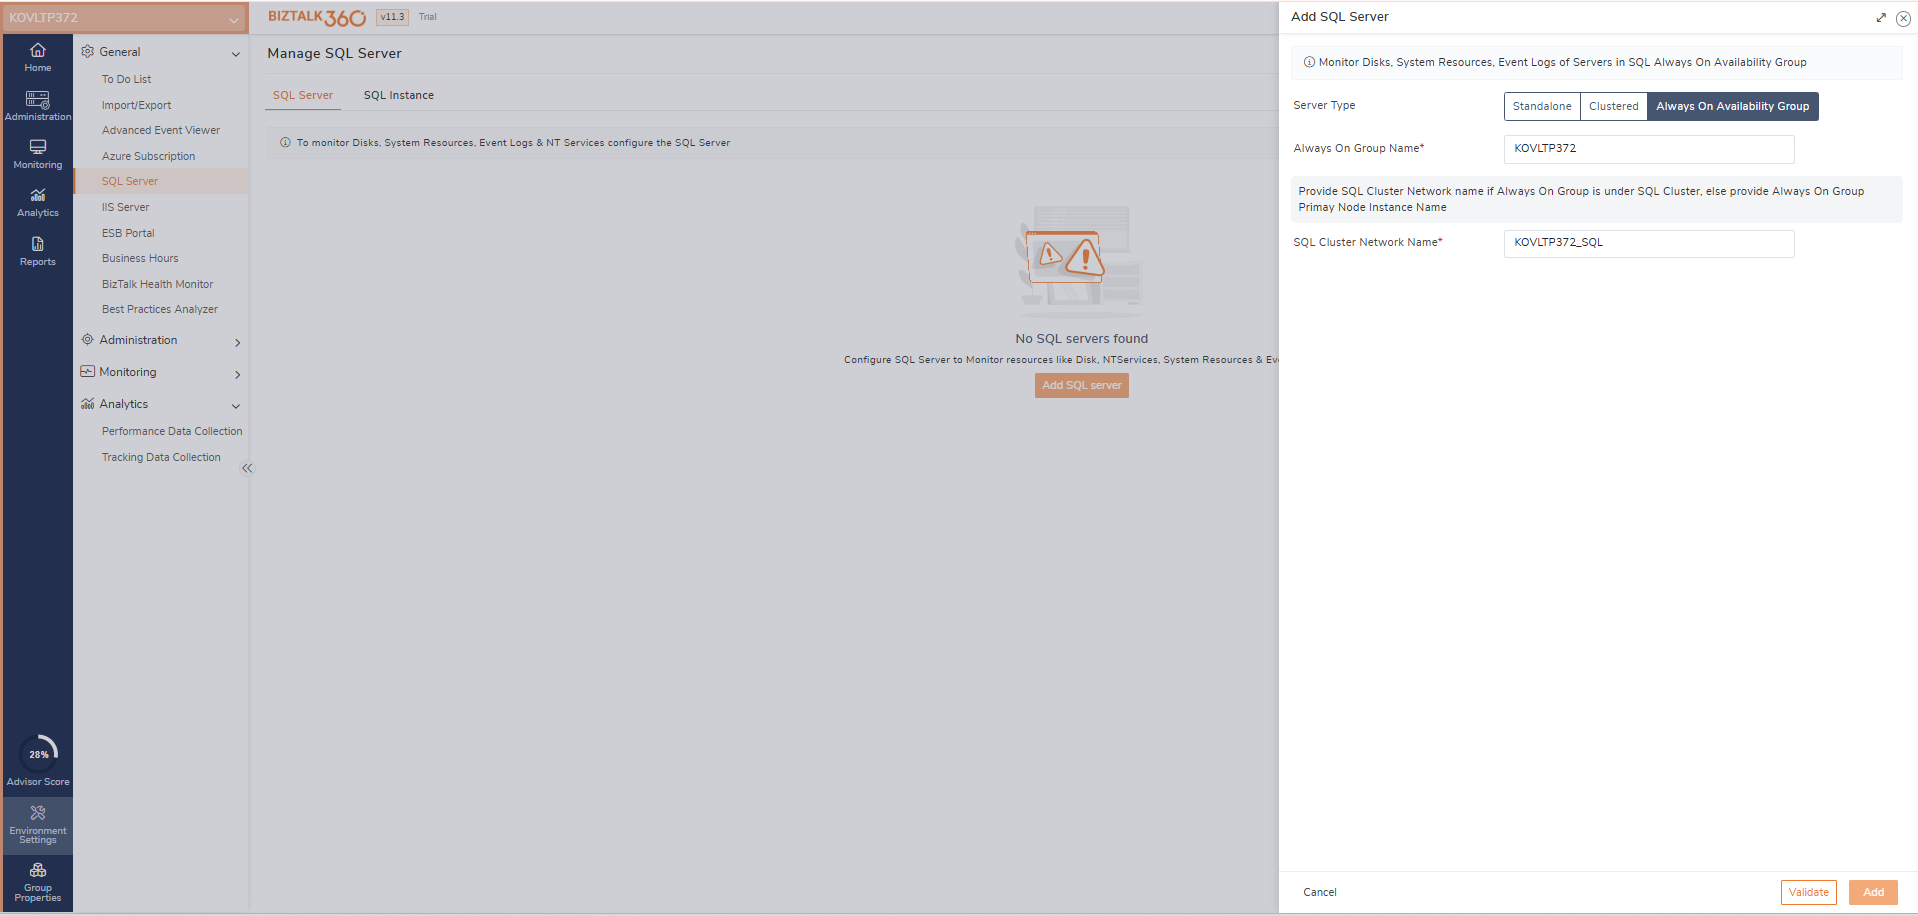
SQL Server monitoring has enhanced by providing the various option to the add the SQL server which are
Always On Group, provide the availability group name and the SQL instance configured for that group, it will list all the active nodes, and it will show the Primary and secondary node indications for the configured server.
BizTalk360 enhances SQL Server AG monitoring by seamlessly tracking the health of the availability group, detecting failover events, and ensuring the active primary is always monitored without manual intervention.
Process monitoring has improved with the new option as “Ports Match”
“Any” option can be used when you want to track the message processing count from a set of BizTalk application’s port and expecting to get healthy alert if at least one among the selected port meets the expected count.
“All” option can be used when you expecting to get healthy alert only when all the selected ports meet the expected count.
Optimized Data Collection Resilience: Improved system efficiency when attempting to collect data from an unavailable server, minimizing delays and resource consumption.
Enhanced Service Continuity: Ensured the Monitoring Service remains operational even after detecting orphaned artifacts, preventing disruptions in monitoring activities.
You can monitor message count processing in an application using analytics widgets by configuring the port frequency as needed. For example, if the widget displays data for the last 24 hours, you can set the plot frequency to hours or minutes for better insights. This provides a clear view of message counts per hour. Additionally, you can aggregate the message count using metrics like Maximum or Average.
Reporting is one of the key features in which now you can alter the subject line of the email alert that triggers from the Report.
SQL query reporting, in this version you can select the multiple queries that needs to be tracked with in a single report.
BizTalk360 Accessibility:Improved the accessibility challenges, providing more details.