
Well, 2021 has been a fantastic year for BizTalk360. One of the things we are extremely passionate about in BizTalk360 is the user experience. That is one of the reasons we invested around 15 months moving from Knockout JS to the latest Angular technology and Intuitively redesigned UI & UX to exceed customer expectations., our team has put immense effort into a massive release of v10.0 to provide a user-centric experience for 80+ features. We also released some interesting features along with this. With no delay let us jump and see the top interesting works we did in 2021.
When the application is growing, we need to be super cautious, not to bloat the UI or make it complex for users to consume. we focused on improving the user experience in the existing features based on the customer feedbacks and the usability problems faced.
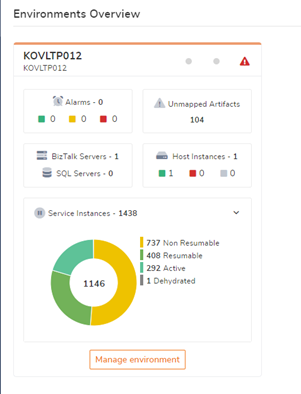
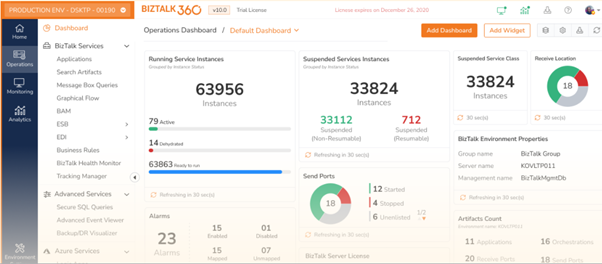
Monitoring Dashboard –Improvised with the dark light theme. Full and collapsed view in the single page Fit to read or Fit to content option is introduced to visualize the graph based on preferences.
Grid Improvements – In most of the data access modules, we used a grid to list the huge set of data. Previously the data are listed as pages where users need to navigate to the next pages to see the data, whereas this has been improvised by binding whole data in a single page. Along with that based on the query result, the table height will get adjusted for the data in the grid.
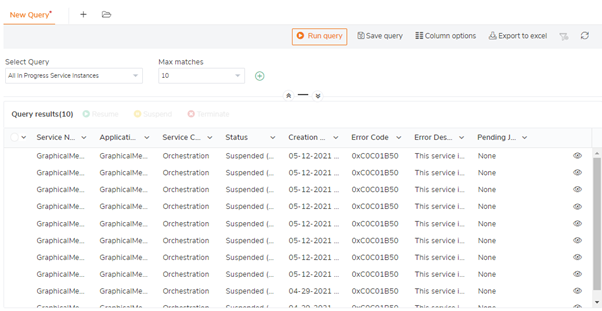
Filter Component –This has been implemented as a generic component to provide the same user experience across the board. Enhanced filtering component is helpful to view the drill-down data in manage alarms, monitoring dashboard, data monitoring dashboard, and governance audit data.
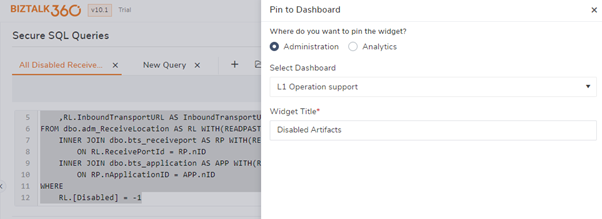
Pin To Dashboard – Through this pin to dashboard feature user can easily pin the frequently used feature into the dashboard, with this user can easily navigate to the desired feature from the dashboard with a single click. Considering the importance, we have enhanced this feature now where users can pin the feature into any dashboard say overview or custom dashboards available in both operation/analytics sections. The query results of Message Box Queries, Secure SQL Queries, and Tracking Queries can also be pinned to the dashboard
Breadcrumbs -Breadcrumbs are added to give an easy-to-read overview and navigation of the application hierarchy. With this user can easily understand and navigate from the current page to the parent and child page.
Card Layout – We allow the users to switch between Card and Grid view based on their preference in manage alarms, license features
Server availability monitoring provides the ability to monitor failover SQL clusters and standalone SQL Servers using the protocols Ping or Telnet. This feature answers the question “Are the BizTalk/SQL Servers up and running?.” BizTalk administrators can choose the option when to receive the alert; either if one of the Servers has gone down or only when all the servers were down.
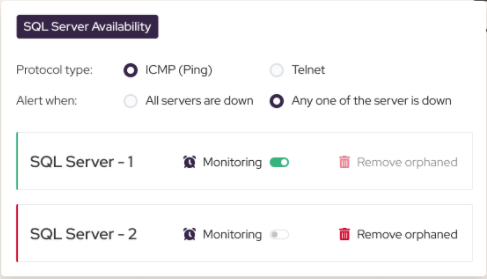
SQL Server configuration is now centralized, where once the SQL server is configured in BizTalk360. the same can be managed in the operation section, monitored in the monitoring section and performance insight can be gathered in the Analytics section.
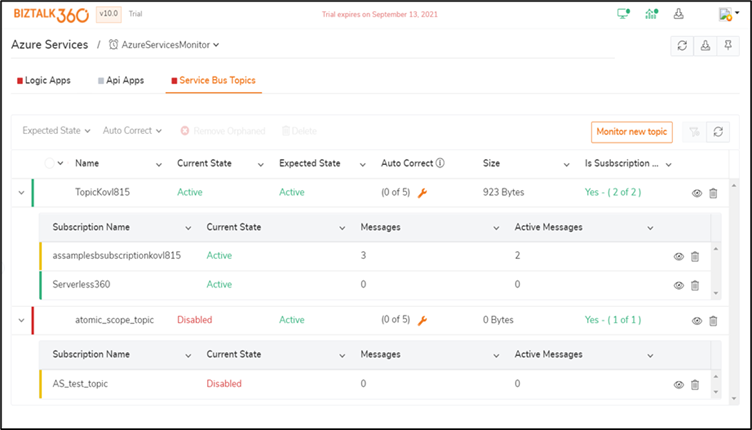
Users can effectively monitor Service Bus Topics and their subscription by simply configuring the Namespace connection string and Topic Name. Once the topic is configured BizTalk360 will detect and list the topic’s details such as its current state, message size, and subscription details. With this user can monitor the state of the topic and by configuring threshold rules you can monitor other topics and subscription metrics.
State-based monitoring – The state can be monitored by configuring the expected state as Active /disabled /Send Disabled. BizTalk360 triggers an alert If the current state of the Topic/Subscription is not as same configured Expected state. Users can also set up Autocorrect for this, where the BizTalk360 system will automatically heal (change the state) if the expected state is not equal to the current state.
Threshold Monitoring – The threshold rule for the below metric can be configured for monitoring, you will be notified if there is any violation in the result if the threshold rule configured
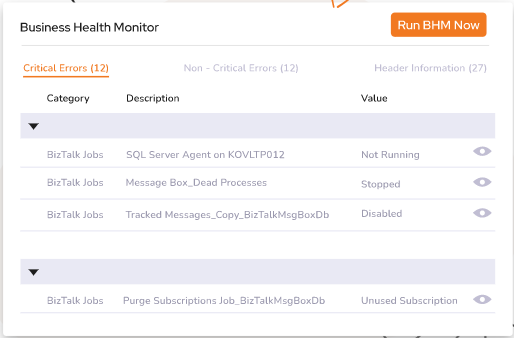
BizTalk360 has already an integration with BHM. This integration enables the BizTalk360 user to schedule BHM and view the output of the different runs of the tool directly from within BizTalk360. You can also manually run BHM, Schedule BHM runs, Run BHM profiles, view and monitor the BHM runs.
You can manage and monitor only the default profile in the previous versions. From this version, we have extended the scope to support multiple profiles.
Manage BHM Profiles – The detailed reports of multiple BHM profiles can be viewed in BizTalk360 operations modules and the profile can be analysed and run by clicking the Run BHM option, which runs all the profiles and generates the report.
Monitoring multiple BHM profiles – The Schedule can be configured to run the selected profile on a specific time duration. More than one profile can be monitored by configuring the threshold rules and mapping that to alarm. BizTalk360 checks for any threshold violation based on the rules configured and the latest report generated and if there is any violation, the same will be notified through an alert.
User Access Policy is one important feature in BizTalk360, where superusers can provide access to certain applications or modules in your BizTalk environment to Normal Users and NT groups. This is not available at the BizTalk admin console. This feature is now extended for the dashboard and secure SQL queries
Keeping security in mind we implemented Governance and Auditing which audits BizTalk level activities from BizTalk360 and most of the BizTalk360 activities too. From this version on we also audit Logic apps and Tracking manager activities.
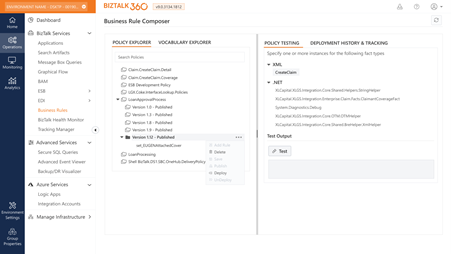
Business Rules are now composed using XSLT. Using XSLT will provide the flexibility to manage the rule conditions. User Experience of managing the rules and policies has been aligned as like BizTalk Rule Composer with context menu.
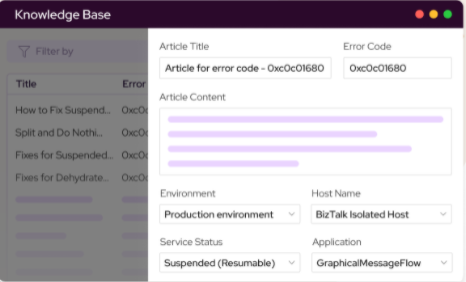
BizTalk360 can attach knowledge base articles to error codes (suspended instances, event viewer events, ESB errors, etc), which will help the support person when they see the same exception happening again. This feature is now made easy to access and manageable within the desired section like Message Box queries (suspended service instances), the Advanced Event Viewer, and the ESB portal.
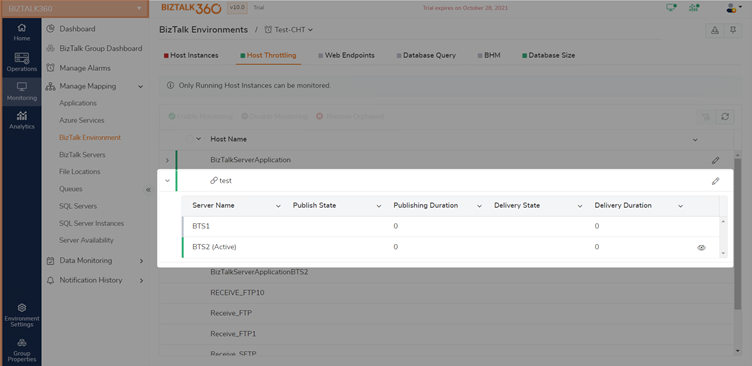
BizTalk Host (Clustered/Non-Clustered) Throttling can be monitored by enabling the monitoring and configuring the monitoring rule for publishing and delivery throttle, alert will get triggered if there is any violation in throttle condition. BizTalk360 helps you to make sure if an Active node in a clustered Setup is working effectively by setting the expected state as ‘At least one Active’.
In the case of cluster host throttling BizTalk360 will automatically pick the active node for monitoring. The cluster nodes are now indicated with an icon and coded with colour to make it clearer.
Here are a few improvements we did in ESB,
The latest version of BizTalk360 will give the users a fresh look & feel. It has more exciting new features and feature improvements. Why not give BizTalk360 a try!
You can take a look at our release history to determine the amount of stuff we have added to the product
