
We are thrilled to announce that in the BizTalk360 version 10.5, user can additionally monitor BizTalk server performance along with Windows performance which is already available from the version 10.4 of BizTalk360
User may now track metrics data relating to BizTalk message, host, and transmission rate with the help of performance monitoring.
Since BizTalk360 is well renowned for its monitoring capabilities, one standout feature that enables user to keep track on and be informed of events relevant to business transactions that are taking place on our BizTalk server is Data Monitoring. For Instance, user may track the number of suspended instances in an application and receive alerts to take the appropriate action. It also provides a wide range of other features that might make it easier for them to keep track of their business activities.
You can answer the question “How effectively is the system and BizTalk server performing its work?” by gathering performance and tracking-related data.
Simply said, the Analytics service of BizTalk360 is in charge of collecting performance and tracking data so that user may view the data in a pleasant graphical format and monitor the actual data for the specific metric counters.
When it comes to server optimization user need to look at various aspects like overall size and design of BizTalk server solution, likewise they also need to keep an eye on some of the performance counters which also impact server performance if there any spikes right?
Also, it’s crucial to monitor the host performance during transactions to control the workload.
User can accomplish all these, by setting up a performance monitoring schedule that will keep an eye on the windows & server performance counters and alert them if any violations take place based on the chosen threshold which helps us to detect performance related bottlenecks.

Since version 10.4, BizTalk360 has simply allowed user to measure Windows Server Performance. As of version 10.5, however, BizTalk360 now provides user with three new primary categories,
Through which user can be able to monitor server performance to guarantee that business operations run smoothly.
To maintain proper operation, it is crucial to monitor how much of the system resources are consumed for servers (BizTalk and SQL).
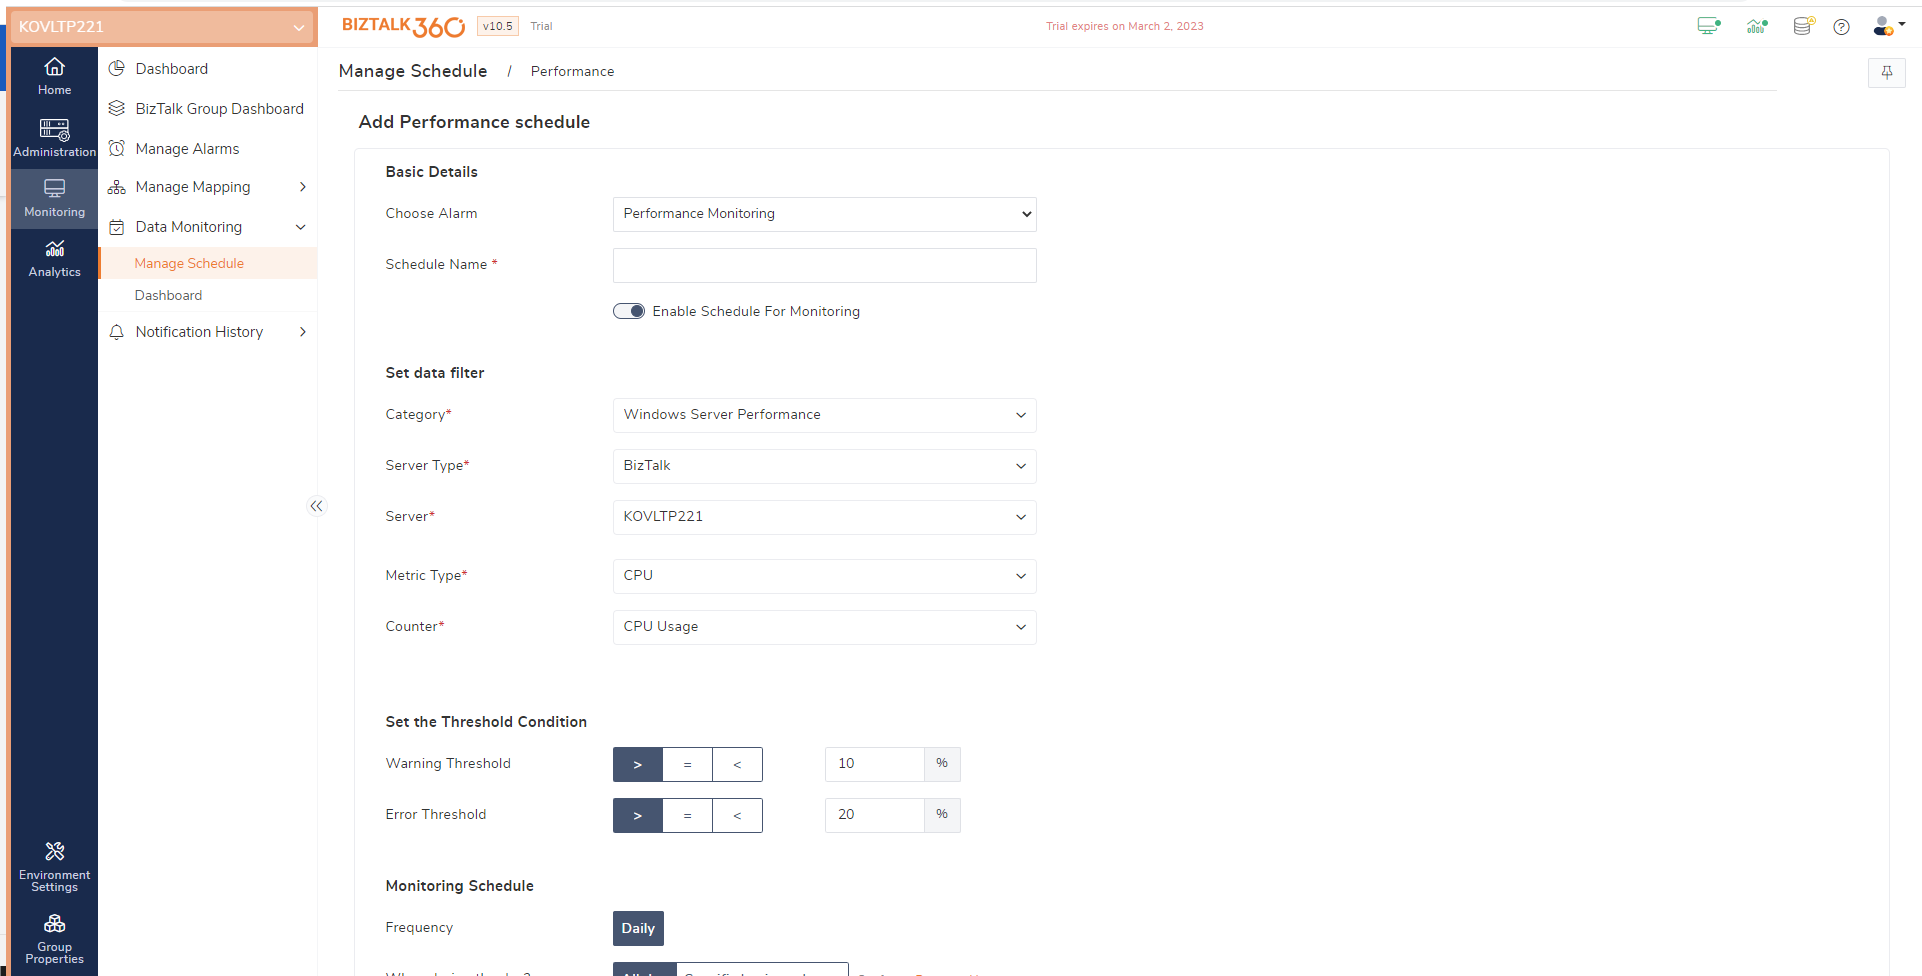
Performance monitoring can be used to keep a check on the following windows performance counters.
Use Case:
Let’s say your BizTalk server has been dealing with a lot of transactions for a while. In that situation, it will be a tedious task often to check the server’s windows CPU and memory utilization in order to prevent any kind of downtime and performance concerns.
BizTalk360, however, can assist you with that.
Simply by creating performance schedules to track CPU & memory utilization along with its threshold value, user will be informed if any violations occur.
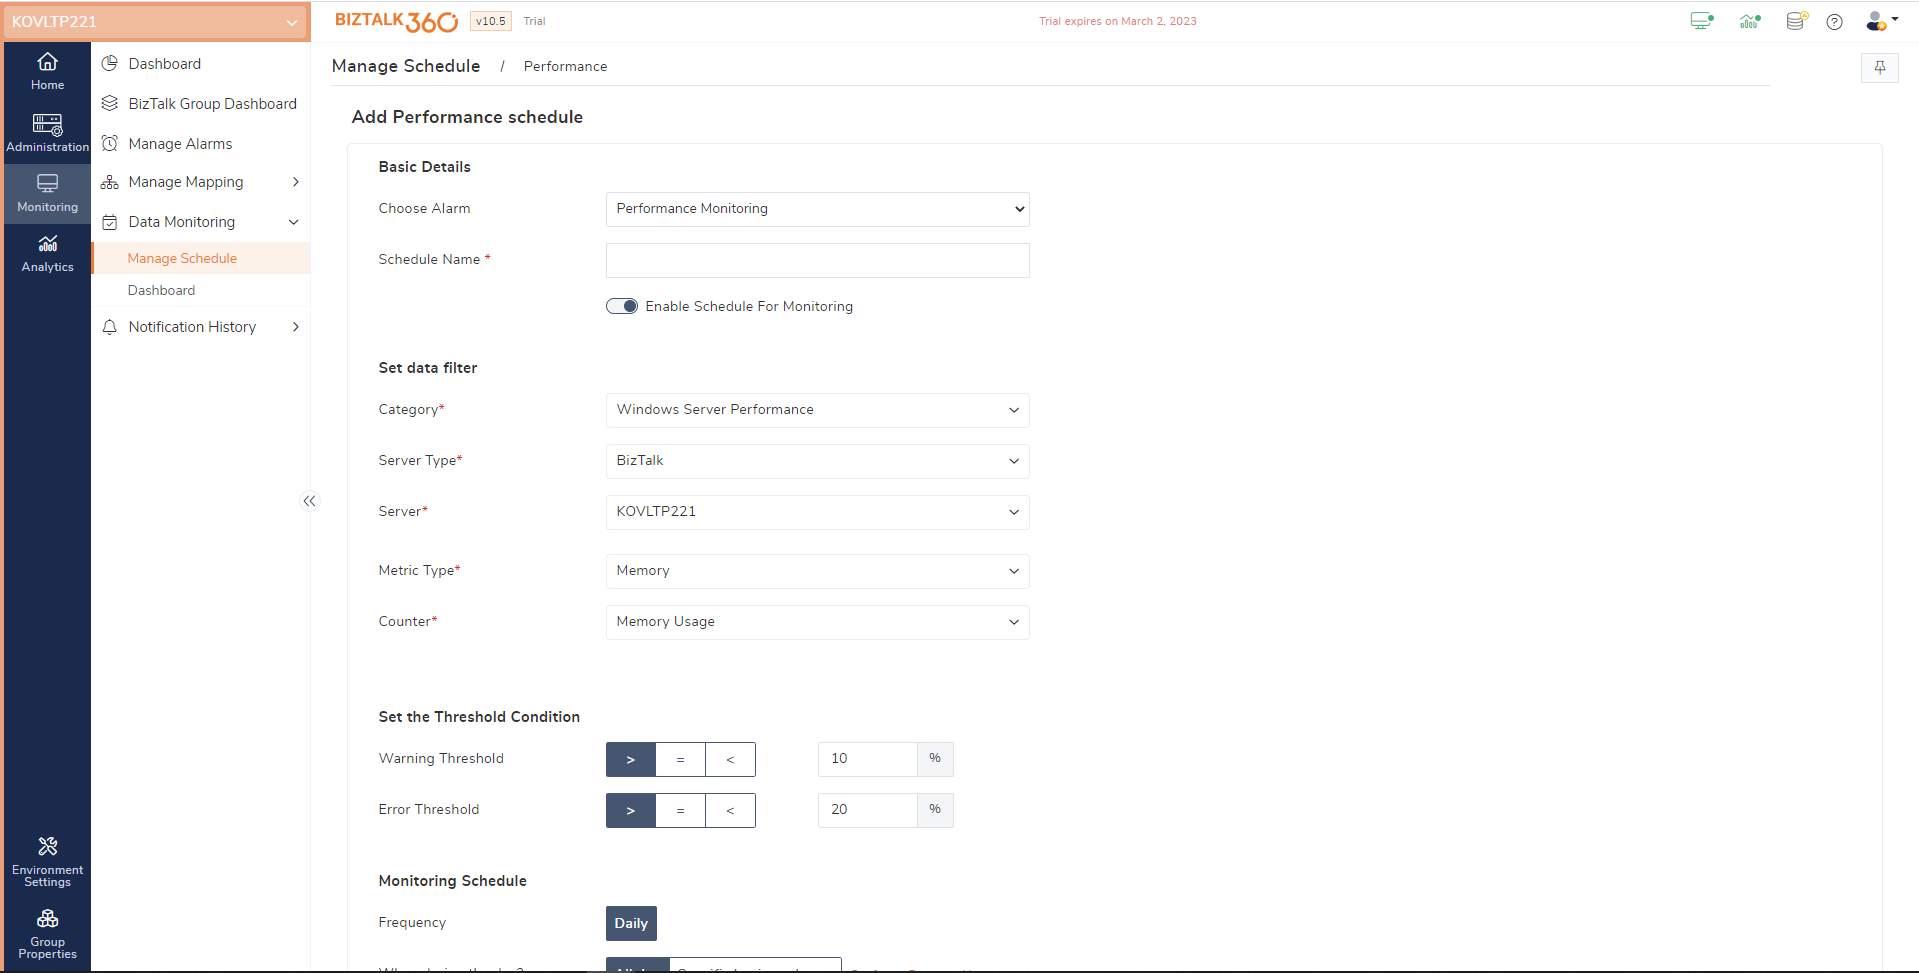
In BizTalk messaging performance, user can monitor messaging performance counters like Average Execution time and Message count
With Average Execution time counter, user can keep track of average execution time taken by the instances during transactions
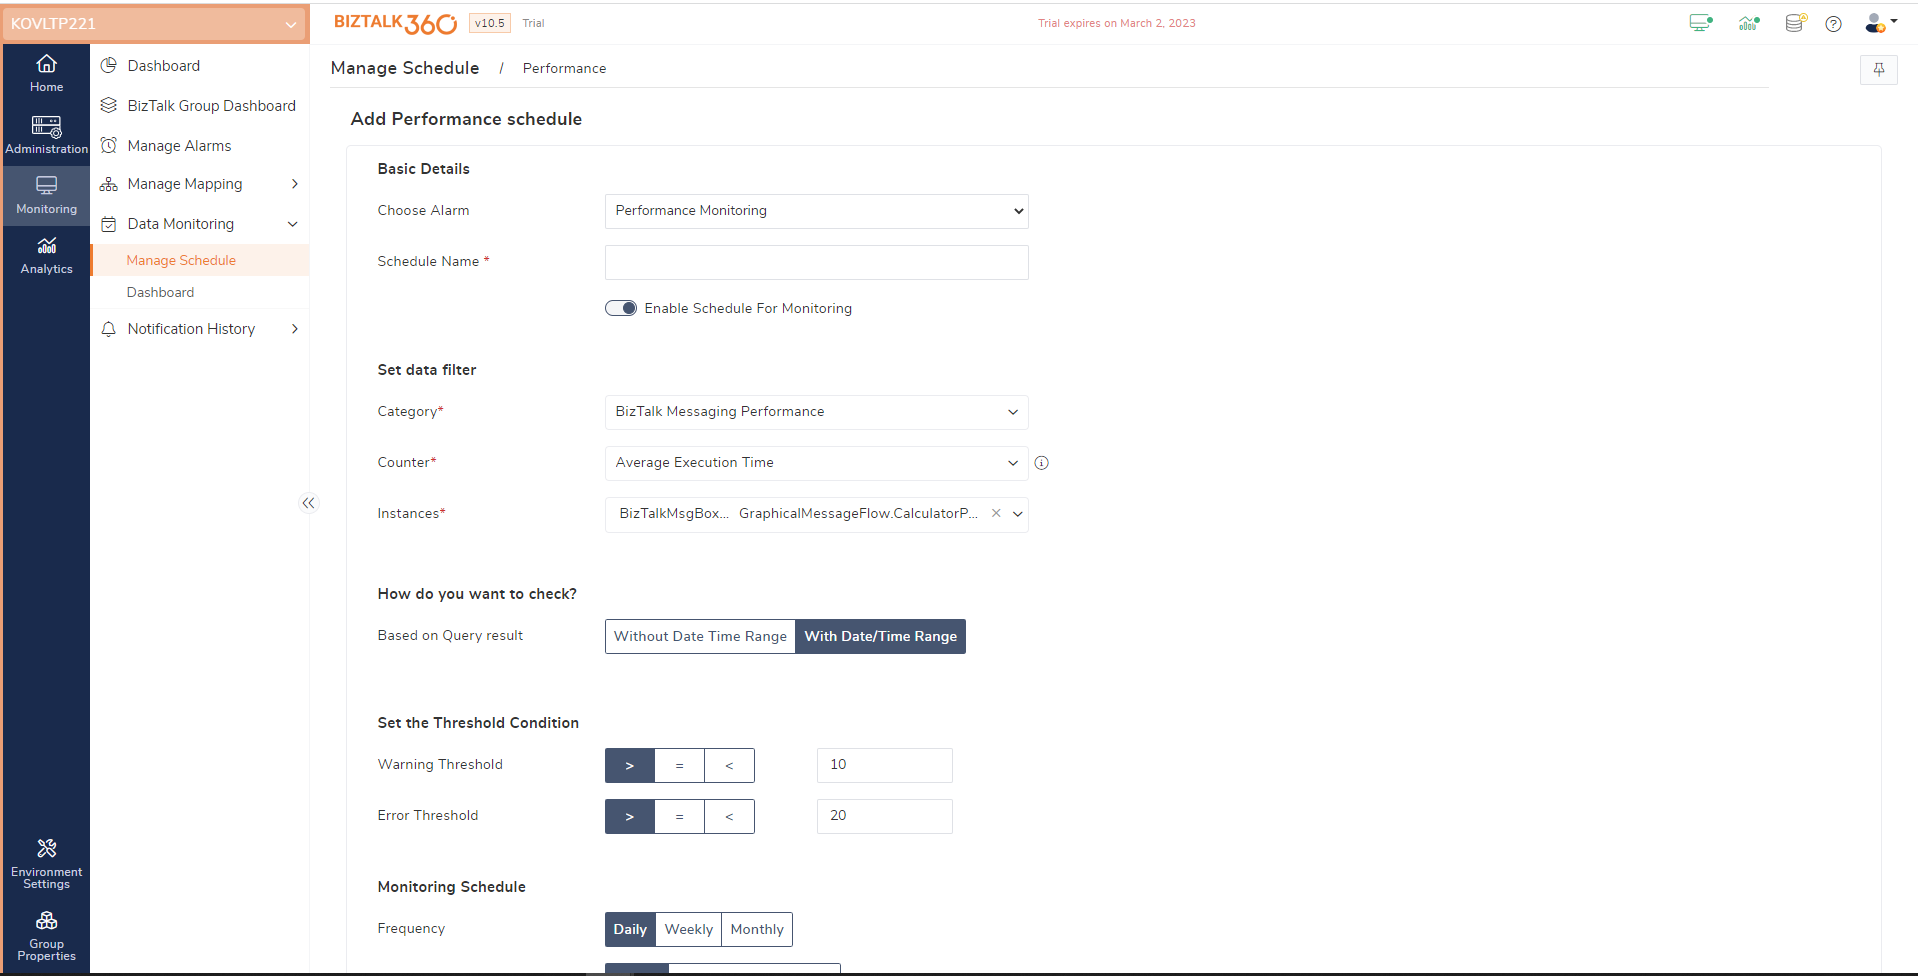
With Message count counter, user can keep track of the actual message counts processed at the application and artifact levels.
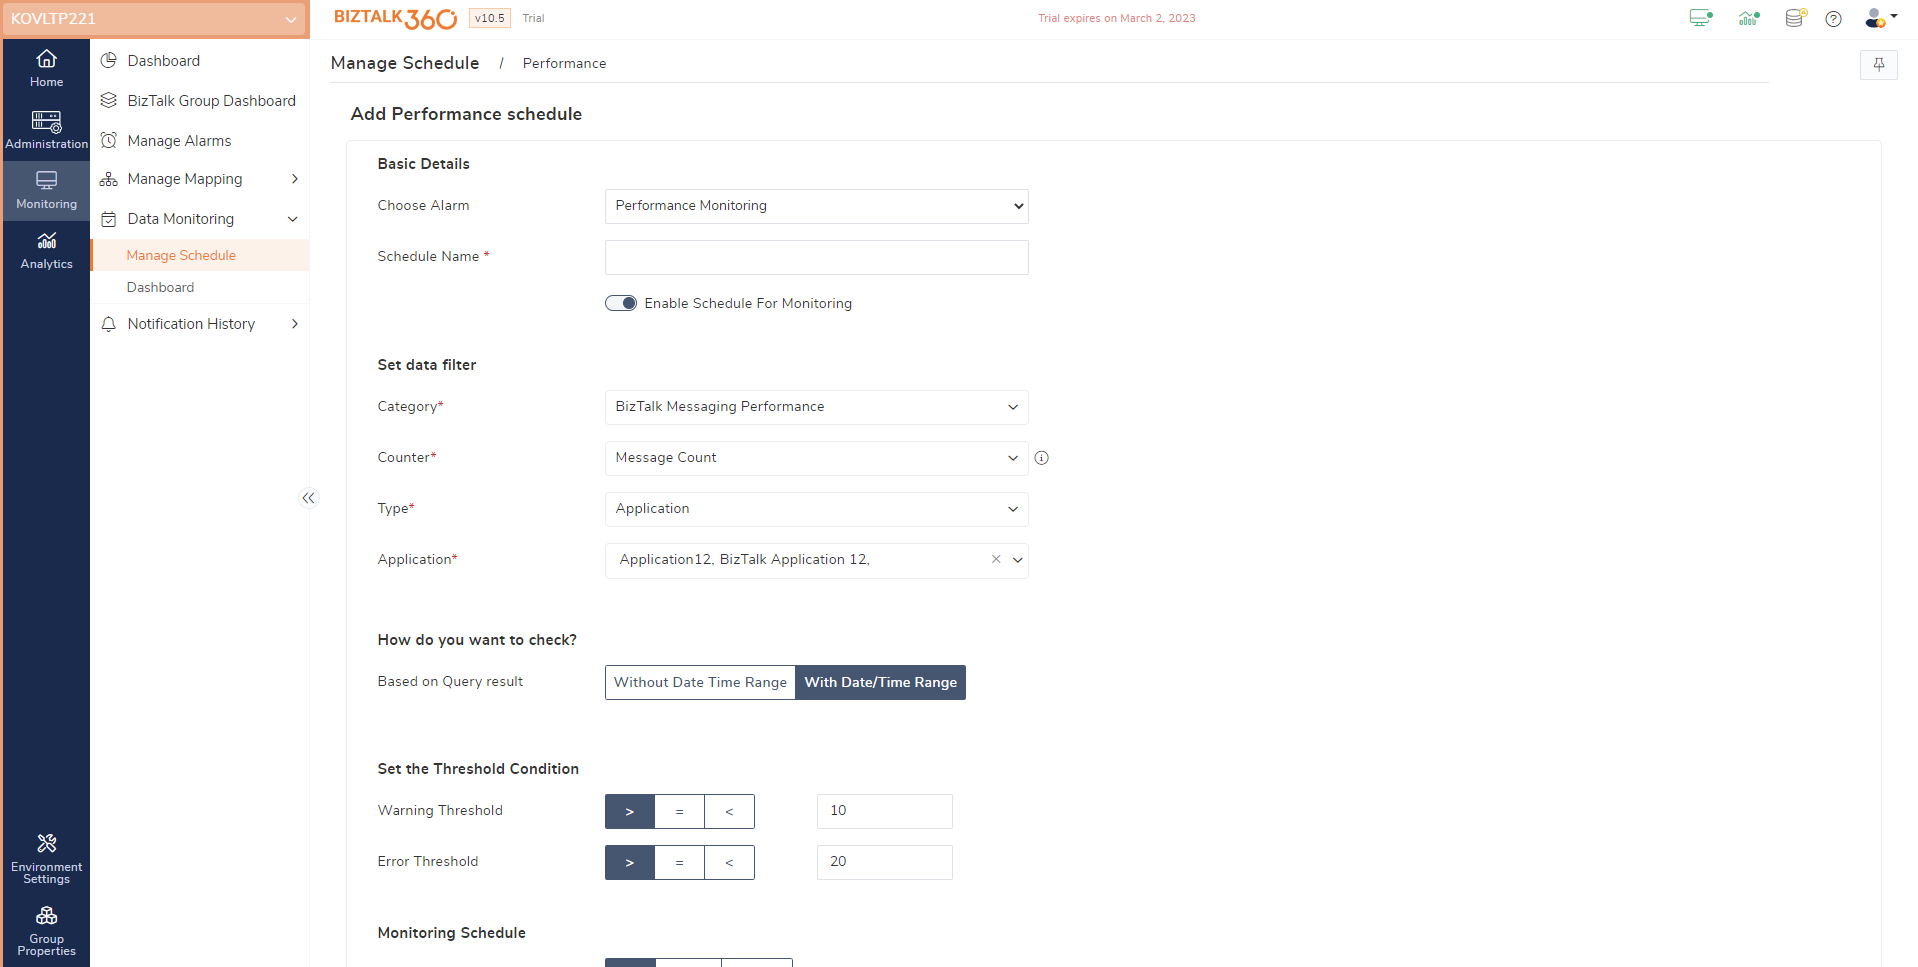
Use Case
If user needs to keep track of how many messages a given artifact or application processes during transactions, performance tracking will enable user to determine the actual message count processed by the selected resources.
If, for example, user need to send one of their partners an acknowledgement detailing total number of messages that were processed by a particular application over a specific time period, Performance monitoring schedule with message count counter will enable user to determine the precise number of messages that have been handled by the artifact.
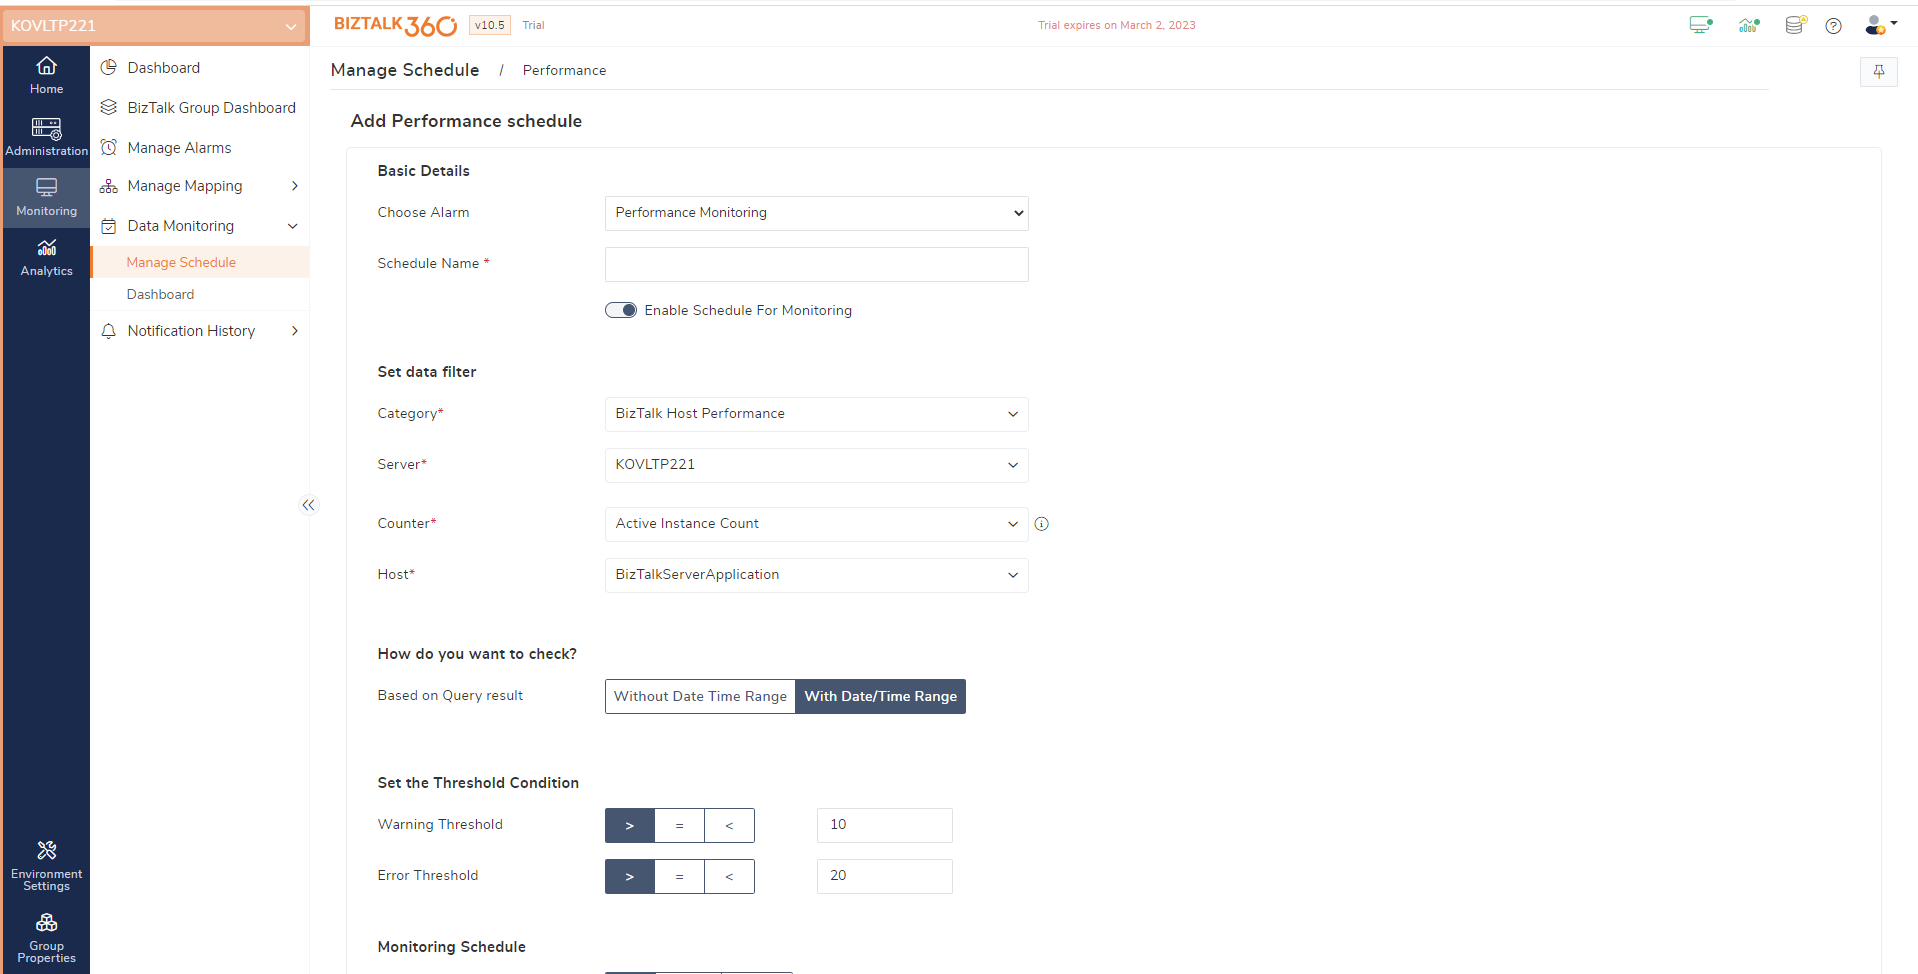
In this category, user will be able to keep an eye on host performance counters, including the host’s CPU and memory usage as well as other throttling counters.
The host performance counters that BizTalk360 can watch are listed below.
Use Case
As an administrator, user should always keep an eye on the state of service instances, including active, suspended, and ready to run. If they notice that their host is too busy to process service instances that are in the ready to run state for an extended period of time, user can find out how many instances are actively running in that host, which can help them manage workload if the host has a high active instance count.
With performance monitoring schedules now, user can keep track of the number of instances that are running in memory while conducting business transactions.
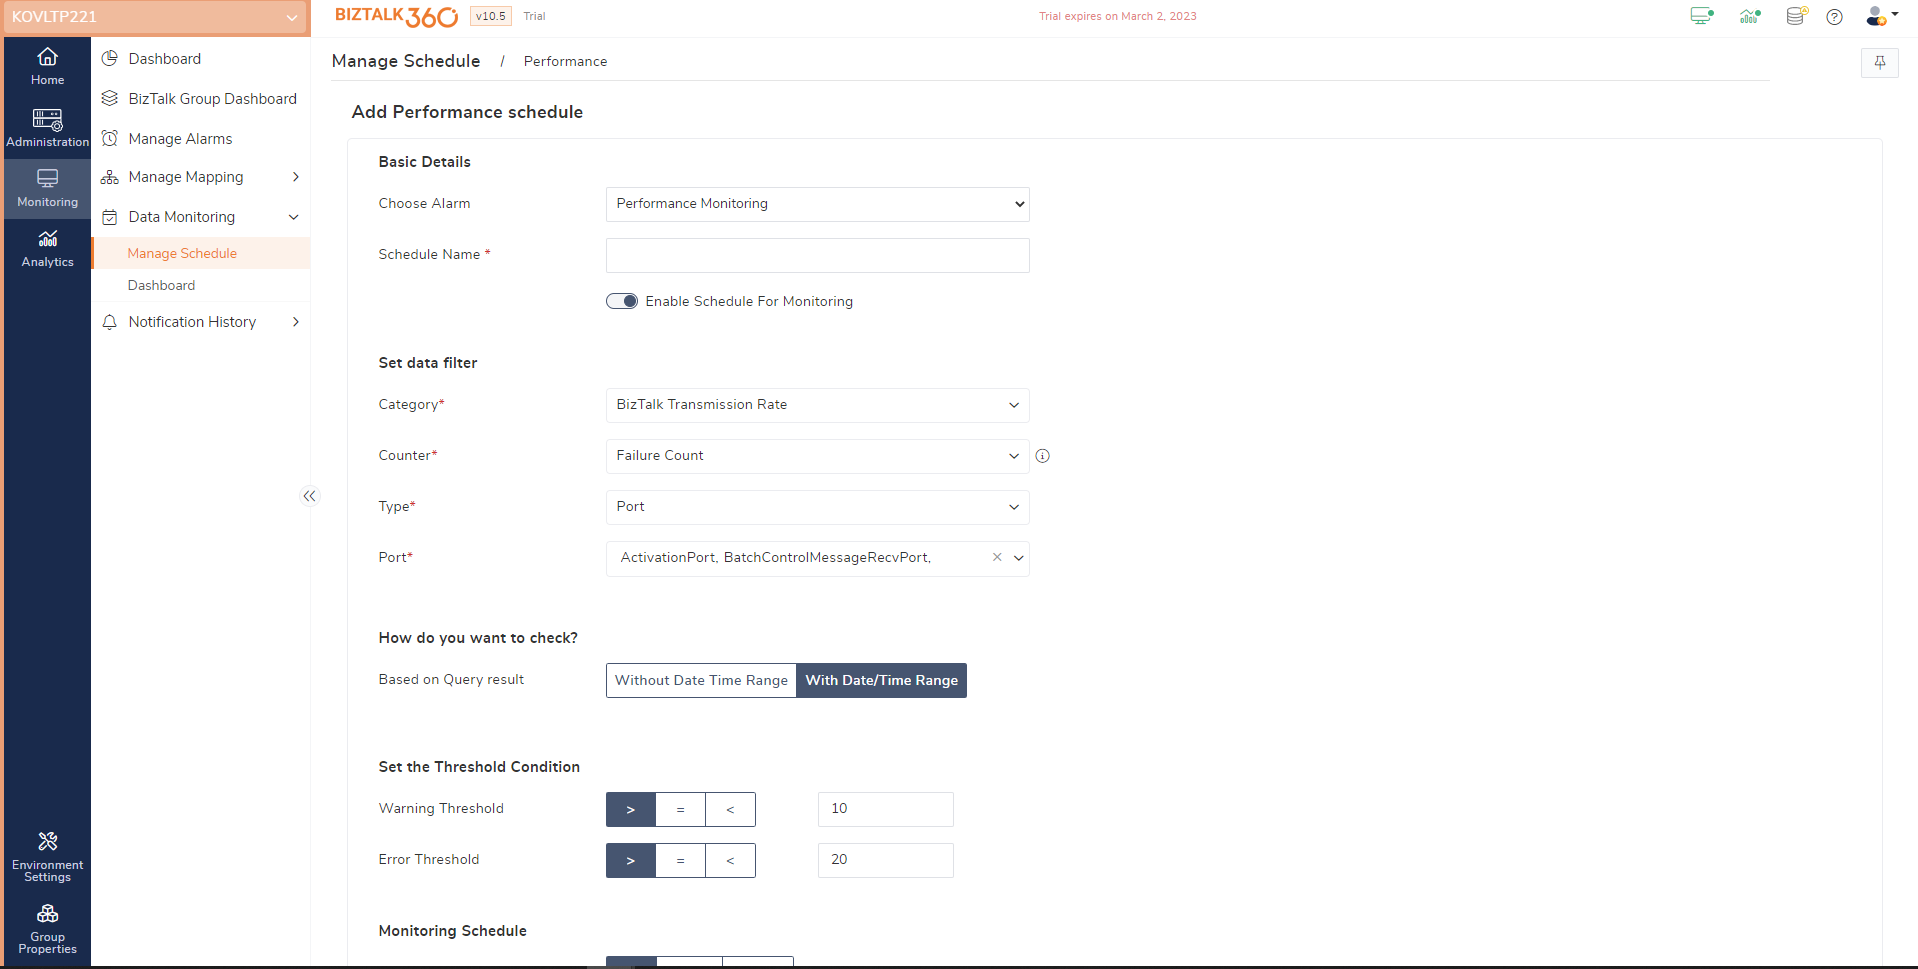
In this category, user can track the number of failure and success messages for both the port and the schema during transactions.
 Use Case
It’s crucial for us to maintain track of the failure count of every port and schema so that we can take the necessary actions when they’re needed during business transmission.
Not all messages sent during transactions are successful, therefore keeping track of the failure count is crucial to taking the proper measures, such as resuming or terminating the instance based on the needs.
User can now track the success and failure count of ports and schemas using performance monitoring schedules.
In addition to the schedule details, user can view the execution details of the data monitoring schedule, such as the actual count and its status in relation to the configured threshold. For instance, it’s crucial to understand why if any of the schedules are returned with a monitor error status; in that case, user can inspect the actual exception in the data monitoring dashboard.
Data monitoring dashboard has been built with two sorts of views for better user experience.
Last but not least, we believe that employing the performance monitoring feature can definitely assist you when resolving issues relating to the server performance.
Would you like to monitor more counters directly from BizTalk360? Please provide us with your feedback via the user voice portal so that we can take it forward based on the votes.
Our aim is to provide features that meet your requirements.
Haven’t tried BizTalk360 yet? I’m sure that you should give it a shot and make benefit out of it 😊
Happy Monitoring!